
RDS Proxy and Aurora Serverless v2: Production Scaling Patterns
Your Lambda functions are hammering the database with thousands of simultaneous connections, and Aurora is rejecting them faster than you can scale. You’ve watched the CloudWatch graphs: invocation count spikes, connection count follows it like a shadow, then the errors cascade. FATAL: remaining connection slots are reserved for replication. The 3am PagerDuty alert isn’t hypothetical—it’s a pattern that repeats across every team that moves high-concurrency workloads to serverless without rethinking their database layer.
The failure mode is deceptively simple. Each Lambda execution environment opens its own database connection. At low traffic, this is fine. At 500 concurrent executions, you’ve got 500 connections fighting over whatever max_connections your Aurora instance allows—a number derived from instance memory, not your traffic profile. Scale the instance to buy headroom and you’re paying for compute you don’t need at 2am on a Tuesday. Keep the instance small and you’re one traffic spike away from connection exhaustion.
What makes this particularly painful in serverless environments is that the standard solutions don’t apply. PgBouncer and HikariCP assume persistent, long-lived processes that can own a connection pool. Lambda’s stateless, ephemeral execution model breaks that assumption entirely. A connection pool per function instance isn’t a pool—it’s just connections with extra steps.
RDS Proxy and Aurora Serverless v2 address this at the infrastructure level, which is the only place it can actually be solved. Together they handle connection multiplexing and capacity scaling in ways that match serverless execution patterns rather than fighting them.
To understand why that combination works, you first need to understand exactly how connections fail at scale—and why the two failure modes, exhaustion and storms, require different thinking.
Why Database Connections Break at Scale
Serverless architectures expose a structural mismatch that traditional applications never encounter: the compute layer scales horizontally and instantly, while the database connection layer remains a finite, instance-bound resource. Understanding exactly where this breaks — and why — determines whether you reach for the right solution.

TCP Connection Overhead Compounds Quickly
Every Lambda function invocation that touches a database establishes a full TCP handshake, a TLS negotiation, and a PostgreSQL or MySQL authentication round-trip before executing a single query. In isolation, this adds 20–50ms of overhead. At 500 concurrent invocations, you are not paying that cost once — you are paying it 500 times simultaneously, often against the same database endpoint. The connection setup cost is not amortized across a pool; it is repeated fresh for each execution context that doesn’t reuse a warm connection.
Lambda execution contexts do maintain connections across warm invocations, but this creates a different problem: idle connections accumulate. A function that last ran three minutes ago holds an open database connection that counts against your limit, even though no work is being done.
max_connections Is Instance-Bound, Not Traffic-Bound
Aurora and RDS set max_connections based on instance memory, not on your expected traffic. A db.r6g.large instance (16GB RAM) allows roughly 1,000 PostgreSQL connections. A db.t4g.medium caps out near 90. These limits do not scale when your application scales. When a Black Friday traffic spike drives 800 simultaneous Lambda invocations, each holding its own connection, a mid-tier instance hits its ceiling before the traffic does.
Two Distinct Failure Modes: Exhaustion vs. Storm
Connection exhaustion is a slow failure. Connections accumulate over time — from idle Lambdas, from connection leaks in error paths, from functions that exit without properly closing connections. The database eventually refuses new connections with FATAL: sorry, too many clients already. This failure is predictable and reproducible.
Connection storms are sudden. A deployment, an autoscaling event, or a cold-start wave from a dormant function triggers hundreds of functions initializing simultaneously. Each one tries to open a connection within the same 200ms window. The database authentication layer serializes these requests, latency spikes, timeouts cascade, and the application fails not from lack of connections, but from the cost of acquiring them all at once.
Why PgBouncer and HikariCP Don’t Transfer
PgBouncer and HikariCP are process-local pool managers. They assume a long-running process that holds a pool of idle connections and loans them to threads on demand. A Lambda function has no persistent process across invocations. Each execution context runs PgBouncer logic independently, defeating the entire purpose — you get the overhead of a pool manager with none of the sharing benefits.
💡 Pro Tip: If you are seeing
too many clientserrors during traffic spikes but not during steady-state load, you are dealing with a connection storm, not exhaustion. The mitigation strategies differ significantly between these two failure modes.
RDS Proxy addresses both failure modes through a centralized, persistent connection pool that lives outside your application runtime — which is exactly what the next section covers.
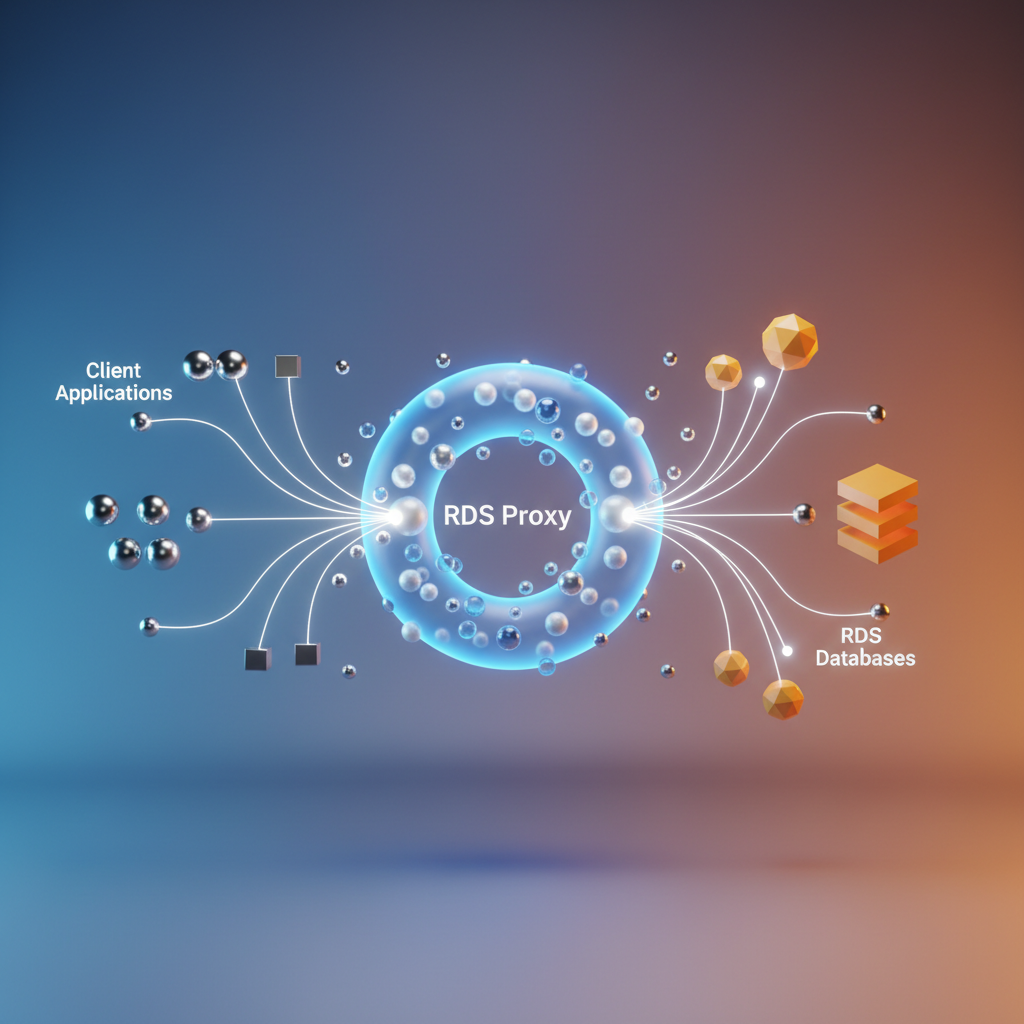
RDS Proxy Architecture: The Database Proxy Pattern in Practice
RDS Proxy sits between your application and your Aurora or RDS database, acting as a persistent connection broker. While your application opens and closes connections freely, the proxy maintains a warm pool of connections to the actual database engine—connections that are expensive to establish and limited in total count.
Connection Multiplexing
The core mechanic is multiplexing: many application connections share a smaller set of database connections. When your Lambda function opens a connection to the proxy endpoint, it receives a logical connection immediately. The proxy maps that logical connection onto an available physical database connection only when a query is actually executing. Between statements, the physical connection returns to the pool and serves another application connection.
This separation is what breaks the one-to-one relationship between application instances and database connections. A fleet of 500 Lambda invocations hitting the proxy simultaneously does not translate to 500 database connections. In practice, the proxy negotiates the minimum number of physical connections needed to handle the active query load, bounded by the MaxConnectionsPercent parameter you configure against the target database’s max_connections.
When Multiplexing Breaks: Connection Pinning
Multiplexing only works when the proxy can safely reassign a physical connection between statements. Several operations break this assumption and cause the proxy to pin a logical connection to a single physical connection for the duration of the session:
- SET statements that modify session-level variables
- Prepared statements that carry session state
- Temporary tables that exist only within a session
- Multi-statement transactions in certain configurations
- Database-specific features such as
GET_LOCK()in MySQL
Pinned connections behave identically to direct connections—the proxy overhead remains, but the pooling benefit disappears. Monitor the DatabaseConnectionsCurrentlySessionPinned CloudWatch metric. A consistently high pin rate signals that your application’s session usage is negating the proxy’s primary advantage.
Transaction Mode vs. Session Mode
RDS Proxy supports two pooling modes. Transaction mode reclaims a physical connection after each transaction commits or rolls back, maximizing pool efficiency. Session mode holds the physical connection for the entire client session, preserving full session semantics at the cost of lower concurrency.
Transaction mode is the default and the correct choice for stateless workloads—Lambda functions, containerized microservices, or anything that treats connections as disposable. Session mode is appropriate when your application relies on session-level constructs that transaction mode would break. The tradeoff is explicit: session mode gives you behavioral compatibility; transaction mode gives you connection density.
Secrets Manager Integration
RDS Proxy integrates directly with AWS Secrets Manager to handle credential rotation without disrupting active connections. The proxy authenticates to the database using credentials it fetches and caches from Secrets Manager. When a rotation occurs, the proxy drains the old credentials gracefully and re-authenticates using the new secret—application connections see no interruption. This makes mandatory credential rotation policies operational rather than ceremonial.
💡 Pro Tip: Configure a dedicated Secrets Manager secret per proxy target group rather than sharing secrets across proxies. This gives you independent rotation schedules and isolates the blast radius of a rotation failure.
With the proxy architecture clear, the next step is standing one up in a real environment—including the IAM authentication configuration that replaces password-based credentials entirely.
Deploying RDS Proxy with Terraform and IAM Auth
Standing up RDS Proxy manually through the console is fine for experimentation, but production deployments demand repeatable infrastructure. The Terraform configuration below covers the full setup: proxy resource, IAM authentication, security groups, and endpoint routing for read/write separation.
Core Proxy Resource
The aws_db_proxy resource requires a few deliberate decisions upfront. IAM authentication and Secrets Manager are not mutually exclusive—the proxy uses Secrets Manager to retrieve the underlying database credentials at connection time, while IAM controls which principals can request connections to the proxy endpoint itself. For Lambda workloads, IAM auth is the right choice: no credential rotation logic in application code, no hardcoded passwords in environment variables, and the IAM token exchange happens transparently through the AWS SDK’s RDS signer.
resource "aws_db_proxy" "aurora_proxy" {  name                   = "aurora-prod-proxy"  debug_logging          = false  engine_family          = "POSTGRESQL"  idle_client_timeout    = 1800  require_tls            = true  role_arn               = aws_iam_role.rds_proxy_role.arn  vpc_security_group_ids = [aws_security_group.rds_proxy_sg.id]  vpc_subnet_ids         = var.private_subnet_ids
  auth {    auth_scheme = "SECRETS"    description = "Aurora master credentials"    iam_auth    = "REQUIRED"    secret_arn  = aws_secretsmanager_secret.aurora_master.arn  }
  tags = {    Environment = "production"    ManagedBy   = "terraform"  }}
resource "aws_db_proxy_default_target_group" "aurora_proxy" {  db_proxy_name = aws_db_proxy.aurora_proxy.name
  connection_pool_config {    connection_borrow_timeout    = 120    max_connections_percent      = 75    max_idle_connections_percent = 50    session_pinning_filters      = ["EXCLUDE_VARIABLE_SETS"]  }}
resource "aws_db_proxy_target" "aurora_cluster" {  db_proxy_name         = aws_db_proxy.aurora_proxy.name  target_group_name     = aws_db_proxy_default_target_group.aurora_proxy.name  db_cluster_identifier = aws_rds_cluster.aurora.id}
max_connections_percent is set to 75 rather than 100. Aurora Serverless v2 needs headroom for internal replication traffic and admin connections—saturating the limit leaves no room for maintenance operations or failover events. For a cluster running at 2 ACUs (roughly 80 max_connections), this reserves approximately 20 connections outside the pool. As the cluster scales up in ACUs, max_connections grows proportionally, and the proxy will claim 75% of that expanded capacity automatically. You do not need to update Terraform on every scaling event.
session_pinning_filters deserves attention. Without EXCLUDE_VARIABLE_SETS, any SET statement pins the client to a specific backend connection for the session duration, defeating the purpose of multiplexing. Most ORMs and connection libraries issue SET statements silently on connect—timezone, application name, search path. This filter prevents those implicit statements from collapsing your effective pool size to one connection per application thread.
connection_borrow_timeout of 120 seconds governs how long the proxy waits before returning an error when no pooled connection is available. For Lambda workloads with bursty concurrency, a generous timeout smooths over spikes; lower it for latency-sensitive APIs where a queued connection represents a user-facing delay.
Security Group Configuration
resource "aws_security_group" "rds_proxy_sg" {  name        = "aurora-proxy-sg"  description = "RDS Proxy security group"  vpc_id      = var.vpc_id
  ingress {    from_port       = 5432    to_port         = 5432    protocol        = "tcp"    security_groups = [aws_security_group.lambda_sg.id]  }
  egress {    from_port       = 5432    to_port         = 5432    protocol        = "tcp"    security_groups = [aws_security_group.aurora_sg.id]  }}
The security group enforces a strict traffic path: Lambda reaches the proxy, and the proxy reaches Aurora. Aurora’s own security group should allow ingress only from rds_proxy_sg, not from Lambda directly. This forces all traffic through the proxy and prevents applications from bypassing the connection pool entirely—an important control in environments where multiple teams share the same VPC.
Read-Only Endpoint Routing
For workloads with significant read traffic, the proxy’s read-only endpoint routes connections to Aurora reader instances automatically, offloading queries from the writer without any application-side logic.
resource "aws_db_proxy_endpoint" "read_only" { db_proxy_name = aws_db_proxy.aurora_proxy.name db_proxy_endpoint_name = "aurora-prod-proxy-ro" vpc_subnet_ids = var.private_subnet_ids vpc_security_group_ids = [aws_security_group.rds_proxy_sg.id] target_role = "READ_ONLY"}The read-only endpoint maintains its own connection pool against the reader fleet. If Aurora promotes a reader to writer during failover, the proxy updates its routing automatically—your application continues issuing reads to the same endpoint hostname without intervention. Note that the read-only endpoint does not accept write statements; Aurora will reject them at the session level, so route only genuine read workloads through it.
💡 Pro Tip: Export both endpoint URLs as SSM parameters or Terraform outputs and reference them by role in application configuration—
DB_WRITE_HOSTandDB_READ_HOST. This keeps routing logic out of application code and makes failover testing straightforward without redeployment.
With the proxy deployed and traffic routing in place, the next critical variable is what Aurora Serverless v2 does on the other end of those connections—specifically how ACU scaling behaves under load and what the cold start window actually looks like in production.
Aurora Serverless v2: Scaling Units and Cold Start Reality
Aurora Serverless v2 replaces the binary stop/start model of v1 with fine-grained, continuous scaling measured in Aurora Capacity Units (ACUs). Understanding what an ACU actually represents—and how the scaling engine behaves under load—is the difference between a well-tuned cluster and one that silently drops connections during traffic spikes.
ACUs: The Capacity Model
One ACU maps to approximately 2 GiB of memory and a proportional share of CPU and network throughput. A cluster configured with a maximum of 8 ACUs has roughly 16 GiB of memory available at peak. The minimum ACU setting (as low as 0.5 ACU) determines your baseline allocation and directly controls two competing concerns: cost at idle and cold start penalty under sudden load.
At 0.5 ACU, the cluster runs on minimal resources between traffic windows. This is appropriate for development environments or workloads with predictable, gradual ramp-ups. Production systems handling unpredictable burst traffic require a higher minimum—typically 2–4 ACUs—to maintain a warm buffer that absorbs the first wave of connections before the scaling engine catches up.
Scale-Up vs. Scale-Down Asymmetry
Aurora Serverless v2 scales up in seconds. When CPU or connection pressure crosses internal thresholds, the engine adds capacity fast enough that most applications never observe the transition. Scale-down operates on a different timescale—measured in minutes, not seconds—to prevent thrashing under workloads with short-lived spikes followed by idle periods.
This asymmetry has a direct design implication: your application must handle the scale-down period gracefully. Connection pools should use idle timeouts shorter than the scale-down window to avoid holding connections open against a cluster that has reduced its capacity allocation.
💡 Pro Tip: Setting your minimum ACU to match your p50 load rather than your p5 idle baseline eliminates the most common cold start complaints in production. The cost delta between 0.5 and 2 ACUs at idle is small; the latency penalty when scaling from cold is not.
Multi-AZ and Reader Scaling
In a Multi-AZ Aurora Serverless v2 configuration, reader instances do not scale independently from the writer. Reader ACU allocation follows the writer’s scaling events with a lag. If your read workload spikes independently of write load, provisioned reader instances are the more predictable choice—they offer consistent capacity without waiting for the serverless scaling engine to respond to reader-specific pressure.
When Provisioned Aurora Wins
Serverless v2 is the wrong tool for workloads with continuously high, stable throughput. If your cluster runs above 8 ACUs for more than 60% of the day, a provisioned instance delivers lower per-hour cost and eliminates scaling latency entirely. Serverless v2 earns its keep on variable workloads—scheduled batch jobs, staging environments, and APIs with significant day/night traffic deltas.
With the capacity model established, the next section covers the concrete wiring: connecting Aurora Serverless v2 through RDS Proxy using Python’s connection pooling libraries and IAM-based authentication.
Connecting Aurora Serverless v2 Through RDS Proxy in Python
With your proxy deployed and Aurora Serverless v2 configured, the application layer is where connection management either holds together or falls apart. Python applications connecting through RDS Proxy need three things done correctly: IAM token generation, SQLAlchemy pool sizing that defers to the proxy, and transaction handling that avoids pinning connections unnecessarily.
Generating IAM Auth Tokens with boto3
RDS Proxy IAM authentication replaces static passwords with short-lived tokens signed by your AWS credentials. The token is valid for 15 minutes and is passed as the database password during connection establishment. Because tokens are time-bounded, the generation function should be called on connection checkout rather than at application startup.
import boto3import os
def generate_rds_auth_token(    proxy_endpoint: str,    port: int,    db_user: str,    region: str = "us-east-1",) -> str:    session = boto3.session.Session()    client = session.client("rds", region_name=region)
    token = client.generate_db_auth_token(        DBHostname=proxy_endpoint,        Port=port,        DBUsername=db_user,        Region=region,    )    return token
The proxy_endpoint here is the proxy endpoint hostname, not the cluster endpoint. Pointing this at the cluster directly bypasses the proxy entirely and defeats the purpose of the architecture. The proxy endpoint takes the form my-proxy.proxy-<id>.<region>.rds.amazonaws.com.
Building the SQLAlchemy Engine
SQLAlchemy’s connection pool and RDS Proxy’s pool are not designed to stack. Running both at full capacity doubles connection overhead and produces misleading wait metrics. The correct approach is to constrain SQLAlchemy’s pool to a small fixed size and let the proxy handle the heavy lifting.
from sqlalchemy import create_engine, eventfrom sqlalchemy.pool import QueuePoolfrom db_auth import generate_rds_auth_tokenimport os
PROXY_ENDPOINT = os.environ["RDS_PROXY_ENDPOINT"]   # e.g. my-proxy.proxy-abc123.us-east-1.rds.amazonaws.comDB_PORT        = int(os.environ.get("DB_PORT", 5432))DB_NAME        = os.environ["DB_NAME"]               # e.g. appdbDB_USER        = os.environ["DB_USER"]               # e.g. app_userAWS_REGION     = os.environ.get("AWS_REGION", "us-east-1")
def get_engine():    token = generate_rds_auth_token(PROXY_ENDPOINT, DB_PORT, DB_USER, AWS_REGION)
    connection_url = (        f"postgresql+psycopg2://{DB_USER}:{token}"        f"@{PROXY_ENDPOINT}:{DB_PORT}/{DB_NAME}"        "?sslmode=require"    )
    engine = create_engine(        connection_url,        poolclass=QueuePool,        pool_size=5,          # Small — proxy multiplexes upstream        max_overflow=2,        pool_pre_ping=True,   # Detects stale connections after Aurora scaling events        pool_recycle=840,     # Recycle before the 15-minute IAM token expires        connect_args={"sslrootcert": "/etc/ssl/certs/ca-certificates.crt"},    )    return engine
pool_recycle=840 is deliberate. At 900 seconds the IAM token expires, and a recycled connection will re-authenticate on checkout, picking up a fresh token. Without this, connections opened near the token boundary fail silently mid-request.
pool_pre_ping=True is equally important for Aurora Serverless v2 specifically. After a scale-down event, idle connections held in SQLAlchemy’s pool are no longer valid at the proxy. Pre-ping issues a lightweight SELECT 1 before handing a connection to your application, catching dead connections before they surface as query errors in production. The overhead is negligible compared to the cost of a failed request.
Handling Transactions Without Pinning
RDS Proxy pins a client connection to a single upstream database connection for the duration of a transaction. Pinning is unavoidable for multi-statement transactions, but leaving connections pinned longer than necessary reduces the proxy’s multiplexing efficiency and can exhaust upstream connection limits under load. Use context managers to keep transaction scope as tight as possible.
from sqlalchemy.orm import sessionmakerfrom database import get_engine
engine = get_engine()Session = sessionmaker(bind=engine)
def transfer_funds(from_account: int, to_account: int, amount: float) -> None:    with Session() as session:        with session.begin():                          # Auto-commits or rolls back            session.execute(                "UPDATE accounts SET balance = balance - :amount WHERE id = :id",                {"amount": amount, "id": from_account},            )            session.execute(                "UPDATE accounts SET balance = balance + :amount WHERE id = :id",                {"amount": amount, "id": to_account},            )    # Connection returns to pool immediately — pinning released
Keep single read queries outside explicit transactions. A bare session.execute without session.begin() runs in autocommit mode through the proxy, which the proxy can multiplex freely across upstream connections. Reserving explicit transactions for writes only is a straightforward discipline that meaningfully improves proxy throughput at scale.
With application connectivity solid, the next priority is knowing when the system is under stress before users notice. The following section covers the specific CloudWatch metrics and query-level instrumentation that surface proxy saturation, Aurora scaling lag, and connection pool pressure in production.
Observability: Metrics That Actually Matter
Blind scaling is failed scaling. Before you hit connection exhaustion or a cold-start wall in production, the signals are already present in CloudWatch—if you know which ones to watch.
RDS Proxy: The Three Metrics That Tell the Whole Story
DatabaseConnectionRequests tracks how many connection requests arrive at the proxy. Paired with ClientConnections, it reveals your pinning rate: when ClientConnections stays high while DatabaseConnectionRequests spikes, the proxy is creating new backend connections instead of reusing pooled ones—the hallmark of session pinning.
QueryDuration is your latency sentinel. A sudden p99 spike here, uncorrelated with application-level latency, points to backend connection saturation rather than slow queries.
The following script creates targeted CloudWatch alarms for all three:
import boto3
cw = boto3.client("cloudwatch", region_name="us-east-1")
def create_proxy_alarm(alarm_name, metric_name, threshold, comparison, stat="Average"):    cw.put_metric_alarm(        AlarmName=alarm_name,        MetricName=metric_name,        Namespace="AWS/RDS",        Dimensions=[{"Name": "ProxyName", "Value": "my-aurora-proxy"}],        Statistic=stat,        Period=60,        EvaluationPeriods=3,        Threshold=threshold,        ComparisonOperator=comparison,        AlarmActions=["arn:aws:sns:us-east-1:123456789012:db-alerts"],        TreatMissingData="notBreaching",    )
## Fire when more than 80% of max connections are in usecreate_proxy_alarm("ProxyConnectionSaturation", "DatabaseConnectionRequests", 800, "GreaterThanThreshold")
## Pin rate proxy: client connections diverging from DB connectionscreate_proxy_alarm("ClientConnectionHigh", "ClientConnections", 950, "GreaterThanThreshold")
## p99 query latency breachcreate_proxy_alarm("QueryLatencyP99", "QueryDuration", 2000, "GreaterThanThreshold", stat="p99")
print("Proxy alarms created.")
Aurora Serverless v2: Tracking ACU Scaling Events
ServerlessDatabaseCapacity is the single most important Aurora Serverless v2 metric. It emits the current ACU value every minute. When this value sits pinned at your configured maximum, you are capacity-constrained—not connection-constrained—and the proxy cannot help you.
Set an alarm at 90% of your MaxCapacity value to get ahead of throttling:
cw.put_metric_alarm( AlarmName="AuroraACUSaturation", MetricName="ServerlessDatabaseCapacity", Namespace="AWS/RDS", Dimensions=[{"Name": "DBClusterIdentifier", "Value": "my-cluster"}], Statistic="Maximum", Period=60, EvaluationPeriods=2, Threshold=14.4, # 90% of MaxCapacity=16 ComparisonOperator="GreaterThanOrEqualToThreshold", AlarmActions=["arn:aws:sns:us-east-1:123456789012:db-alerts"],)Correlating Proxy Metrics with Lambda Concurrency
The scaling ceiling emerges when you overlay ClientConnections against Lambda’s ConcurrentExecutions in a single CloudWatch dashboard. A linear relationship between the two confirms healthy pooling. A superlinear relationship—where connections grow faster than concurrency—confirms pinning is active and your multiplexing ratio has collapsed.
💡 Pro Tip: Create a CloudWatch metric math expression dividing
ClientConnectionsbyConcurrentExecutions. A ratio consistently above 1.5 is your early warning that session pinning is degrading pool efficiency before users report timeouts.
With instrumentation in place, you now have the data to make a deliberate architectural decision: keep the proxy, tune it, or remove it entirely. That tradeoff analysis is exactly what the next section covers.
Production Tradeoffs and When to Skip the Proxy
RDS Proxy is not universally beneficial. Adding it to every Aurora deployment because it handles connection pooling is the wrong mental model—the right question is whether the tradeoff fits your specific workload.
The Latency Tax
Every query through RDS Proxy carries an additional 2–5ms overhead. For OLTP workloads executing hundreds of short queries per request, this overhead is negligible against typical query execution times of 10–50ms. For a checkout flow running 20 queries per transaction, you are adding at most 100ms of cumulative overhead—usually acceptable.
The calculus changes for long-running analytical queries. A reporting query that already takes 8 seconds does not benefit from connection pooling, because the connection itself is held for the query’s duration and cannot be multiplexed. Worse, the proxy introduces multiplexing latency on top of a workload that never had a connection exhaustion problem to begin with. Direct connections to Aurora are the correct choice for these workloads.
Cost Model Reality
RDS Proxy pricing is based on vCPU count of the underlying Aurora cluster. For a db.r6g.2xlarge with 8 vCPUs, expect roughly $0.015 per vCPU-hour, adding approximately $87/month to your bill. The offset comes from running smaller Aurora instances: a proxied db.r6g.large often handles the same concurrent Lambda load as an unproxied db.r6g.2xlarge, because peak connection counts no longer drive instance sizing. Run the numbers against your current instance tier before assuming proxy cost is overhead.
Pre-Cutover Pinning Checklist
Connection pinning—where the proxy pins a client to a single backend connection, defeating multiplexing—is the most common production surprise. Before routing production traffic through the proxy, validate the following:
- Audit all queries for
SETstatements, temporary tables, andGET_LOCK()calls, all of which trigger pinning - Deploy to a staging environment and inspect the
DatabaseConnectionsCurrentlySessionPinnedCloudWatch metric under realistic load - Confirm your application does not use multi-statement transactions spanning multiple requests
- Verify IAM authentication token rotation does not exceed the 15-minute validity window under high connection churn
💡 Pro Tip: A
DatabaseConnectionsCurrentlySessionPinnedvalue consistently above 10% indicates application-level changes are required before proxy deployment provides meaningful benefit.
With these tradeoffs mapped and your observability foundation in place, you have everything needed to deploy, tune, and validate this architecture in production—and to make an informed decision about where the proxy earns its keep and where it doesn’t.
Key Takeaways
- Set Aurora Serverless v2 minimum ACUs to at least 0.5 in production to avoid cold-start latency spikes during scale-up events
- Configure RDS Proxy pool size to 80% of Aurora’s max_connections, leaving headroom for administrative connections and monitoring
- Audit your ORM transaction boundaries before enabling RDS Proxy—any SET statement or advisory lock will pin the connection and negate pooling benefits
- Use IAM authentication with RDS Proxy instead of static credentials to enable zero-downtime credential rotation through Secrets Manager
- Monitor ServerlessDatabaseCapacity against your configured maximum ACUs; sustained saturation means your min/max ACU range needs adjustment