
Production-Ready DigitalOcean Kubernetes: From Zero to Resilient DOKS Clusters
You’ve outgrown your single-server setup and need Kubernetes, but AWS EKS feels overengineered and expensive for your mid-sized application. DigitalOcean’s managed Kubernetes promises simplicity, but getting from a basic cluster to production-ready infrastructure requires navigating node pools, load balancers, and storage that actually works.
The appeal is obvious: click a few buttons in the DigitalOcean dashboard, wait five minutes, and you’ve got a Kubernetes cluster. The kubectl commands work, pods start running, and you feel productive. Then you hit the first real load spike and watch your single node pool thrash as it tries to autoscale both your memory-hungry data processing jobs and your latency-sensitive API servers on the same hardware. Or you provision a LoadBalancer service and discover your monthly bill just jumped $12 per endpoint because you didn’t understand how DigitalOcean’s load balancer integration actually works. Or worse, you lose a node during a routine maintenance window and realize your StatefulSets can’t reschedule because you never configured the CSI driver correctly.
The gap between “I have a working DOKS cluster” and “I have a production-ready DOKS cluster” is wider than DigitalOcean’s documentation suggests. You need to understand what DigitalOcean manages versus what lands squarely in your operational responsibility. You need node pools designed for actual workload characteristics, not the default “one pool with autoscaling enabled” that most tutorials recommend. You need to know which DigitalOcean services integrate cleanly with Kubernetes primitives and which ones require custom operators or manual wiring.
The foundation of getting this right starts with understanding exactly what you’re getting when you provision a DOKS cluster—and more importantly, what you’re not getting.
DOKS Architecture: Understanding the Managed Control Plane Model
DigitalOcean Kubernetes (DOKS) implements a shared responsibility model that fundamentally shapes how you architect production workloads. Understanding where DigitalOcean’s management ends and your ownership begins determines your cluster’s reliability, cost efficiency, and operational overhead.
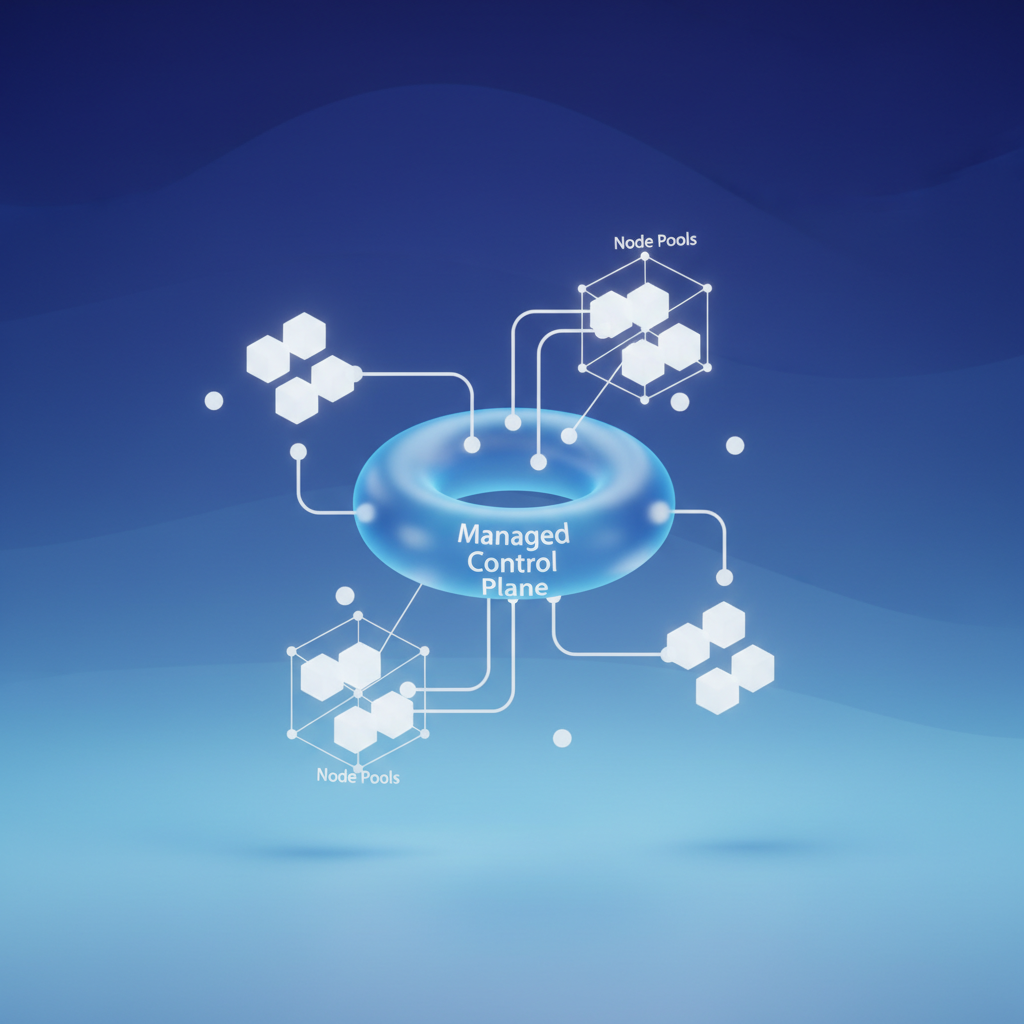
Control Plane: Fully Managed, Zero Overhead
DigitalOcean operates the entire control plane infrastructure—etcd clusters, API servers, controller managers, and schedulers—across multiple availability zones within a region. You never SSH into control plane nodes, patch Kubernetes versions manually, or monitor etcd disk IOPS. DigitalOcean handles automatic backups, high availability configuration, and version upgrades through their managed service layer.
This abstraction eliminates an entire class of operational complexity. You don’t configure kube-apiserver flags, tune etcd compaction settings, or worry about control plane certificate rotation. For teams accustomed to self-managed clusters on EC2 or bare metal, this shift requires trusting DigitalOcean’s SLA (99.95% uptime) and accepting that deep control plane customization isn’t available. The tradeoff is dramatic: hours of toil eliminated in exchange for standardized, battle-tested infrastructure.
Node Pools: Your Responsibility, Your Architecture
While DigitalOcean manages the control plane, you own everything about worker nodes. Node pools are groups of Droplets (DigitalOcean’s VMs) that run your workload Pods. Each pool has a single Droplet size, enabling you to match instance types to workload characteristics.
Production architectures typically deploy three distinct node pools. A system pool runs cluster-critical workloads like CoreDNS, the CSI driver, and monitoring agents. Use smaller Droplets (2 vCPU, 4GB RAM) with auto-scaling disabled to maintain predictable costs. A general-purpose pool handles stateless application workloads with auto-scaling between 3-10 nodes based on CPU utilization. A high-memory pool isolates memory-intensive services like Redis or Elasticsearch, preventing resource contention with your core application tier.
This separation provides blast radius control. When a memory leak crashes high-memory nodes, your API servers continue serving traffic from the general-purpose pool. Node pool taints and tolerations enforce workload placement, preventing accidental scheduling of database Pods onto underpowered system nodes.
Cost Optimization Through Right-Sizing
DOKS billing is transparent: you pay only for worker node Droplets at standard hourly rates. The control plane is free. This pricing model rewards architectural discipline.
Avoid the common mistake of provisioning 8 vCPU, 16GB Droplets “just in case.” Start with smaller instances and scale horizontally through auto-scaling. A cluster with six 2 vCPU nodes costs the same as three 4 vCPU nodes but provides better fault tolerance and bin-packing efficiency for microservices architectures.
Monitor actual resource utilization using Kubernetes metrics. If your nodes consistently run below 40% CPU and 50% memory, you’re overpaying. Resize node pools during maintenance windows by creating new pools with smaller Droplets, cordoning old nodes, and draining workloads gracefully.
With control plane management handled and node pool architecture designed for resilience, the next step is creating your first production cluster using DigitalOcean’s CLI tooling.
Creating Your First Production DOKS Cluster with doctl
While DigitalOcean’s web console provides a straightforward way to launch clusters, production environments demand reproducible infrastructure-as-code. The doctl CLI enables declarative cluster provisioning with proper node pool architecture from day one, ensuring consistent deployments across environments and enabling version-controlled infrastructure changes.
Installing and Authenticating doctl
First, install the DigitalOcean command-line tool and authenticate:
## Install doctl (macOS example)brew install doctl
## Generate API token at cloud.digitalocean.com/account/api/tokensdoctl auth init
## Verify authentication and available regionsdoctl kubernetes options regions
## List available Kubernetes versionsdoctl kubernetes options versions
## Check available node sizes and pricingdoctl kubernetes options sizes
💡 Pro Tip: Store your API token in a secrets manager rather than shell history. For CI/CD pipelines, use scoped tokens with Kubernetes-only permissions to limit blast radius in case of credential compromise.
Before creating your cluster, inspect available options to make informed decisions about region selection, Kubernetes version, and node sizing. Production clusters should use stable Kubernetes versions rather than the latest release to avoid compatibility issues with ecosystem tools.
Designing Node Pools for Workload Isolation
Production clusters benefit from separating workload types across dedicated node pools. A three-pool architecture provides operational flexibility while maintaining cost efficiency:
## Create cluster with initial system pooldoctl kubernetes cluster create prod-doks-01 \  --region nyc3 \  --version 1.29.1-do.0 \  --node-pool "name=system-pool;size=s-4vcpu-8gb;count=3;tag=system;auto-scale=true;min-nodes=3;max-nodes=5" \  --wait
## Add dedicated pool for stateful workloads (databases, caches)doctl kubernetes cluster node-pool create prod-doks-01 \  --name stateful-pool \  --size s-4vcpu-8gb-amd \  --count 2 \  --tag stateful \  --auto-scale \  --min-nodes=2 \  --max-nodes=6
## Add pool for batch processing and background jobsdoctl kubernetes cluster node-pool create prod-doks-01 \  --name batch-pool \  --size c-8 \  --count=1 \  --tag batch \  --auto-scale \  --min-nodes=0 \  --max-nodes=10
This architecture delivers several operational advantages:
- System pool isolation: Critical Kubernetes system components (CoreDNS, metrics-server, kube-proxy) run on dedicated nodes, preventing application workloads from starving cluster control plane services
- Stateful workload protection: Databases and caching layers get predictable performance without interference from burst traffic or batch processing
- Cost optimization: Batch pools can scale to zero during idle periods, and compute-optimized instances provide better price-performance for CPU-intensive jobs
The --wait flag ensures the cluster is fully provisioned before returning control, preventing race conditions in automated pipelines. Tags enable firewall rules, monitoring queries, and cost allocation across different workload types.
Configuring Cluster Autoscaling
DOKS integrates with Kubernetes Cluster Autoscaler automatically. The --auto-scale flags above enable per-pool autoscaling, but verify the configuration:
## Retrieve cluster credentialsdoctl kubernetes cluster kubeconfig save prod-doks-01
## Verify autoscaler deploymentkubectl get deployment cluster-autoscaler -n kube-system
## Check autoscaler configurationkubectl describe configmap cluster-autoscaler-status -n kube-system
## Monitor autoscaler decisions in real-timekubectl logs -n kube-system -l app=cluster-autoscaler --tail=50 -f
The autoscaler monitors pod scheduling failures and scales node pools within defined boundaries. Unlike self-managed clusters, DOKS handles autoscaler version compatibility and control plane integration automatically. The autoscaler respects pod disruption budgets and avoids scaling down nodes running pods with local storage or those protected by PDBs.
Understanding autoscaler behavior is critical for production stability. The autoscaler only adds nodes when pods are in a Pending state due to insufficient resources, and it only removes nodes after a configurable scale-down delay (default 10 minutes) to prevent thrashing during traffic spikes.
Securing Cluster Access with Firewalls
By default, DOKS clusters expose the Kubernetes API publicly with certificate-based authentication. Production deployments should restrict API access using DigitalOcean Cloud Firewalls:
## Create firewall allowing API access only from office and CI/CD networksdoctl compute firewall create \  --name prod-doks-api-firewall \  --inbound-rules "protocol:tcp,ports:443,sources:addresses:203.0.113.0/24,addresses:198.51.100.0/24" \  --tag-names k8s:prod-doks-01
## Verify firewall rulesdoctl compute firewall list
## For additional security, create VPC-private clusterdoctl kubernetes cluster create prod-doks-private \  --region nyc3 \  --version 1.29.1-do.0 \  --vpc-uuid <your-vpc-uuid> \  --node-pool "name=system-pool;size=s-4vcpu-8gb;count=3"
💡 Pro Tip: DOKS manages the control plane firewall automatically. Your firewall rules apply only to worker nodes. For API restrictions, use DigitalOcean’s VPC and private clusters feature available in
doctlwith the--vpc-uuidflag. Private clusters keep the Kubernetes API on your VPC network, requiring VPN or bastion access.
Validating Your Cluster
Confirm your cluster is production-ready with these verification steps:
## Check all node pools are healthykubectl get nodes -o wide
## Verify system components are runningkubectl get pods -n kube-system
## Validate node pool taggingkubectl get nodes --show-labels
## Test autoscaling by deploying a resource-intensive workloadkubectl create deployment scale-test --image=nginx --replicas=50kubectl get pods -w
## Verify connectivity to DigitalOcean serviceskubectl run test-pod --image=curlimages/curl --rm -it -- curl -I https://api.digitalocean.com
## Clean up test workloadkubectl delete deployment scale-test
These validation steps confirm that node pools are correctly sized, system components are operational, autoscaling responds to resource pressure, and network connectivity to DigitalOcean’s API is functional for integration with managed services.
With your multi-pool cluster provisioned and autoscaling configured, the next step is integrating DigitalOcean’s native container registry and persistent storage to complete your infrastructure foundation.
Integrating DigitalOcean Container Registry and Persistent Storage
With your DOKS cluster running, the next step is wiring up DigitalOcean’s native container registry and storage services. This integration eliminates external dependencies while keeping container images and persistent data within the same infrastructure boundary—critical for performance, security, and simplified access control.
Authenticating DOKS with DigitalOcean Container Registry
DigitalOcean Container Registry (DOCR) provides private image storage with integrated vulnerability scanning. Unlike external registries requiring separate credentials, DOKS clusters authenticate to DOCR using DigitalOcean’s API token stored as a Kubernetes secret.
First, ensure your registry exists and obtain a read-only access token:
## Create registry (one-time operation)doctl registry create my-company-registry
## Generate registry credentials for Kubernetesdoctl registry kubernetes-manifest | kubectl apply -f -
This command creates a registry-my-company-registry secret in the default namespace containing Docker credentials. For production workloads, apply this secret to each namespace where pods pull private images:
apiVersion: apps/v1kind: Deploymentmetadata: name: api-service namespace: productionspec: replicas: 3 selector: matchLabels: app: api template: metadata: labels: app: api spec: imagePullSecrets: - name: registry-my-company-registry containers: - name: api image: registry.digitalocean.com/my-company-registry/api:v1.2.3 ports: - containerPort: 8080💡 Pro Tip: Use
doctl registry kubernetes-manifest --namespace productionto generate the secret YAML for specific namespaces, or create the secret once and copy it across namespaces withkubectl get secret registry-my-company-registry -n default -o yaml | sed 's/namespace: default/namespace: production/' | kubectl apply -f -
DOCR credentials expire after seven days by default. For production environments, implement automated secret rotation using a CronJob that regenerates credentials and updates the secret before expiry. This prevents image pull failures during deployments. Additionally, enable registry garbage collection to automatically remove untagged manifests and reduce storage costs—particularly important when running frequent CI/CD pipelines that push ephemeral build artifacts.
Configuring Persistent Storage with DigitalOcean Volumes
DOKS includes the DigitalOcean CSI driver pre-installed, enabling automatic provisioning of block storage volumes through PersistentVolumeClaims. The default do-block-storage StorageClass handles volume creation, attachment, and lifecycle management.
For a StatefulSet requiring persistent storage—like PostgreSQL or Redis—declare a volumeClaimTemplate:
apiVersion: apps/v1kind: StatefulSetmetadata: name: postgres namespace: dataspec: serviceName: postgres replicas: 1 selector: matchLabels: app: postgres template: metadata: labels: app: postgres spec: containers: - name: postgres image: postgres:16-alpine env: - name: POSTGRES_PASSWORD valueFrom: secretKeyRef: name: postgres-secret key: password volumeMounts: - name: data mountPath: /var/lib/postgresql/data volumeClaimTemplates: - metadata: name: data spec: accessModes: ["ReadWriteOnce"] storageClassName: do-block-storage resources: requests: storage: 50GiEach replica receives a dedicated 50GB block storage volume, automatically provisioned in the same datacenter region as your cluster. Volumes persist beyond pod lifecycle and reattach during rescheduling—essential for stateful workloads.
Block storage volumes support dynamic resizing without downtime. To expand a volume, edit the PVC’s storage request and apply the change—the CSI driver handles the underlying resize operation. Note that shrinking volumes is not supported; plan initial capacity accordingly based on growth projections. For workloads requiring high IOPS, consider provisioning larger volumes since DigitalOcean block storage performance scales linearly with capacity (1 IOPS per GB, up to 7,500 IOPS).
Leveraging Spaces for Backup and Object Storage
While block storage handles database volumes, DigitalOcean Spaces provides S3-compatible object storage for backups, logs, and media files. Applications access Spaces using standard S3 SDKs with DigitalOcean endpoints.
Store Spaces credentials as a Kubernetes secret and mount them into backup jobs:
apiVersion: batch/v1kind: CronJobmetadata: name: postgres-backup namespace: dataspec: schedule: "0 2 * * *" jobTemplate: spec: template: spec: containers: - name: backup image: registry.digitalocean.com/my-company-registry/pg-backup:latest env: - name: S3_ENDPOINT value: "nyc3.digitaloceanspaces.com" - name: S3_BUCKET value: "my-company-backups" - name: AWS_ACCESS_KEY_ID valueFrom: secretKeyRef: name: spaces-credentials key: access-key - name: AWS_SECRET_ACCESS_KEY valueFrom: secretKeyRef: name: spaces-credentials key: secret-key restartPolicy: OnFailureSpaces supports lifecycle policies for automatic backup retention management. Configure rules to transition older backups to cheaper storage tiers or delete them after your compliance window expires. For multi-region disaster recovery, enable Spaces CDN to replicate objects across DigitalOcean’s edge network, or implement cross-region replication by running backup jobs that copy critical data to Spaces buckets in geographically distant datacenters.
With container images in DOCR, stateful data on block storage volumes, and backups flowing to Spaces, your DOKS cluster now leverages the full DigitalOcean stack. The next step is exposing services to external traffic with DigitalOcean’s integrated load balancing.
Load Balancing and Ingress: From LoadBalancer Services to Gateway API
DigitalOcean Kubernetes automatically provisions cloud load balancers when you create a Service with type: LoadBalancer. While this integration is elegant, each LoadBalancer Service creates a separate $12/month DigitalOcean Load Balancer. For production clusters running multiple services, this cost accumulates quickly. The solution is consolidating traffic through a single ingress controller.
Understanding DigitalOcean’s LoadBalancer Integration
When you deploy this service:
apiVersion: v1kind: Servicemetadata: name: web-app annotations: service.beta.kubernetes.io/do-loadbalancer-protocol: "http" service.beta.kubernetes.io/do-loadbalancer-algorithm: "round_robin"spec: type: LoadBalancer ports: - port: 80 targetPort: 8080 selector: app: webThe DigitalOcean Cloud Controller Manager detects the LoadBalancer type and provisions a managed load balancer within 60-90 seconds. The external IP appears in kubectl get svc once provisioning completes. This works, but ten services means ten load balancers and $120/month in infrastructure costs before you’ve served a single request.
DigitalOcean’s load balancers offer several configuration options through service annotations. The do-loadbalancer-algorithm annotation supports round_robin (default) and least_connections for traffic distribution. For production workloads, least_connections often provides better performance under variable request durations. You can also configure health checks with do-loadbalancer-healthcheck-protocol, do-loadbalancer-healthcheck-path, and do-loadbalancer-healthcheck-check-interval-seconds to customize how the load balancer monitors backend health.
The do-loadbalancer-size-slug annotation controls load balancer capacity. Available sizes include lb-small (10,000 concurrent connections, $12/month), lb-medium (50,000 connections, $30/month), and lb-large (100,000 connections, $60/month). Start with lb-small during development and scale as traffic patterns emerge. Right-sizing prevents over-provisioning while ensuring sufficient capacity for production loads.
Installing NGINX Ingress Controller
The standard pattern is deploying a single ingress controller that uses one LoadBalancer Service, then routing traffic via Ingress resources. Install the NGINX Ingress Controller with:
helm repo add ingress-nginx https://kubernetes.github.io/ingress-nginxhelm repo update
helm install ingress-nginx ingress-nginx/ingress-nginx \  --namespace ingress-nginx \  --create-namespace \  --set controller.service.annotations."service\.beta\.kubernetes\.io/do-loadbalancer-name"="production-ingress-lb" \  --set controller.service.annotations."service\.beta\.kubernetes\.io/do-loadbalancer-protocol"="http" \  --set controller.metrics.enabled=true \  --set controller.podAnnotations."prometheus\.io/scrape"="true"
This creates exactly one DigitalOcean Load Balancer fronting the ingress controller. Now you can route unlimited services through a single entry point.
Monitor the load balancer provisioning with kubectl get svc -n ingress-nginx -w. Once the EXTERNAL-IP transitions from <pending> to an actual IP address, your ingress controller is ready to accept traffic. The controller runs as a DaemonSet by default, placing one pod on each node to distribute ingress traffic efficiently across your cluster.
Routing Traffic with Ingress Resources
After the controller is running, create Ingress resources to define routing rules:
apiVersion: networking.k8s.io/v1kind: Ingressmetadata: name: production-ingress annotations: cert-manager.io/cluster-issuer: "letsencrypt-prod" nginx.ingress.kubernetes.io/ssl-redirect: "true"spec: ingressClassName: nginx tls: - hosts: - api.example.com - app.example.com secretName: production-tls rules: - host: api.example.com http: paths: - path: / pathType: Prefix backend: service: name: api-service port: number: 8080 - host: app.example.com http: paths: - path: / pathType: Prefix backend: service: name: frontend-service port: number: 3000Both applications now share the same load balancer. The ingress controller terminates TLS and routes based on the Host header, reducing your load balancer costs from $24/month to $12/month for these two services.
NGINX Ingress supports advanced routing patterns through annotations. Use nginx.ingress.kubernetes.io/rewrite-target for path rewriting, nginx.ingress.kubernetes.io/rate-limit for request throttling, and nginx.ingress.kubernetes.io/whitelist-source-range for IP-based access control. These annotations transform the ingress controller into a capable application gateway without requiring additional infrastructure.
💡 Pro Tip: Use
service.beta.kubernetes.io/do-loadbalancer-size-slugto control load balancer capacity. Start withlb-small(10k concurrent connections) and scale tolb-mediumorlb-largeas traffic grows. Right-sizing prevents over-provisioning during development.
Gateway API: The Future of Kubernetes Traffic Management
Kubernetes Gateway API provides a more expressive model than Ingress. NGINX and Cilium both support Gateway API on DOKS, offering advanced routing capabilities like header-based routing, traffic splitting, and cross-namespace route attachment. While Ingress resources remain the production standard in 2026, Gateway API adoption is accelerating for teams requiring sophisticated traffic management without service mesh complexity.
Gateway API separates infrastructure concerns (GatewayClass and Gateway resources) from application routing (HTTPRoute and TCPRoute resources). This separation enables platform teams to manage gateway infrastructure while application teams define routes independently. For multi-tenant clusters or organizations with platform engineering teams, this model provides clearer operational boundaries than the monolithic Ingress resource model.
With ingress properly configured, your cluster can serve dozens of applications through a single load balancer. The next challenge is understanding what’s happening inside that traffic flow. Observability tooling transforms your cluster from a black box into a transparent, debuggable system.
Observability with Cilium Hubble and Prometheus
Production clusters demand comprehensive visibility into both network traffic and resource utilization. DOKS clusters ship with Cilium as the default CNI, which includes Hubble—a powerful network observability layer built directly into the data plane. Combined with DigitalOcean’s 1-Click Kubernetes apps for Prometheus and Grafana, you gain complete observability without the operational overhead of managing multiple monitoring systems.
Enabling Cilium Hubble for Network Observability
Cilium Hubble provides deep visibility into service dependencies, network flows, and security policies. While DOKS enables Cilium by default, Hubble UI requires explicit activation.
Enable Hubble using the Cilium CLI:
## Install Cilium CLICILIUM_CLI_VERSION=$(curl -s https://raw.githubusercontent.com/cilium/cilium-cli/main/stable.txt)curl -L --remote-name-all https://github.com/cilium/cilium-cli/releases/download/${CILIUM_CLI_VERSION}/cilium-linux-amd64.tar.gz{,.sha256sum}tar xzvfC cilium-linux-amd64.tar.gz /usr/local/binrm cilium-linux-amd64.tar.gz{,.sha256sum}
## Enable Hubble on your DOKS clustercilium hubble enable --ui
## Port-forward to access Hubble UIcilium hubble ui
Hubble UI launches at localhost:12000, providing real-time visibility into DNS queries, HTTP requests, and network policies. For production deployments, expose Hubble UI through an Ingress resource with proper authentication rather than port-forwarding.
Beyond the UI, Hubble’s CLI provides powerful querying capabilities for troubleshooting network issues. Use cilium hubble observe to filter and inspect flows in real-time:
## Watch all traffic to a specific podcilium hubble observe --pod default/frontend
## Monitor denied traffic from network policiescilium hubble observe --verdict DROPPED
## Trace HTTP requests between servicescilium hubble observe --protocol http --follow
These CLI commands prove invaluable during incident response, allowing you to correlate application errors with network-level events. Hubble metrics can also be exported to Prometheus using the hubble.metrics.enabled Helm value, providing historical network flow data for capacity planning and security auditing.
Deploying Prometheus and Grafana via 1-Click Apps
DigitalOcean’s 1-Click apps provide pre-configured, production-ready deployments of the kube-prometheus-stack, which includes Prometheus, Grafana, and Alertmanager with DOKS-specific dashboards.
Install from the DigitalOcean control panel (Kubernetes → your-cluster → Marketplace → Monitoring) or via kubectl:
apiVersion: v1kind: Namespacemetadata: name: monitoring---apiVersion: helm.toolkit.fluxcd.io/v2beta1kind: HelmReleasemetadata: name: kube-prometheus-stack namespace: monitoringspec: interval: 30m chart: spec: chart: kube-prometheus-stack version: '55.5.0' sourceRef: kind: HelmRepository name: prometheus-community namespace: flux-system values: prometheus: prometheusSpec: retention: 30d storageSpec: volumeClaimTemplate: spec: storageClassName: do-block-storage accessModes: ["ReadWriteOnce"] resources: requests: storage: 50Gi grafana: adminPassword: "change-me-immediately" persistence: enabled: true storageClassName: do-block-storage size: 10Gi💡 Pro Tip: The 1-Click installation automatically configures ServiceMonitors for DOKS-managed components including the control plane metrics endpoint, eliminating manual Prometheus configuration.
After deployment, access Grafana by port-forwarding (kubectl port-forward -n monitoring svc/kube-prometheus-stack-grafana 3000:80) and logging in with the configured admin password. The pre-installed dashboards include cluster-level views of CPU, memory, and disk utilization, along with pod-specific metrics and network statistics. For production access, configure an Ingress with TLS termination and integrate with your SSO provider using Grafana’s OAuth support.
Configuring Alerts for Node and Pod Health
Production clusters require proactive alerting for resource exhaustion and pod failures. Configure PrometheusRules to alert on critical conditions:
apiVersion: monitoring.coreos.com/v1kind: PrometheusRulemetadata: name: doks-cluster-alerts namespace: monitoringspec: groups: - name: node-health interval: 30s rules: - alert: NodeMemoryPressure expr: kube_node_status_condition{condition="MemoryPressure",status="true"} == 1 for: 5m labels: severity: warning annotations: summary: "Node {{ $labels.node }} under memory pressure" - alert: NodeDiskPressure expr: kube_node_status_condition{condition="DiskPressure",status="true"} == 1 for: 5m labels: severity: warning annotations: summary: "Node {{ $labels.node }} experiencing disk pressure" - name: pod-health interval: 30s rules: - alert: PodCrashLooping expr: rate(kube_pod_container_status_restarts_total[15m]) > 0 for: 5m labels: severity: critical annotations: summary: "Pod {{ $labels.namespace }}/{{ $labels.pod }} crash looping" - alert: PodNotReady expr: kube_pod_status_phase{phase!="Running",phase!="Succeeded"} == 1 for: 10m labels: severity: warning annotations: summary: "Pod {{ $labels.namespace }}/{{ $labels.pod }} not ready"Configure Alertmanager to route alerts to Slack, PagerDuty, or email by editing the alertmanager.yaml ConfigMap in the monitoring namespace. A well-configured alerting pipeline reduces mean time to detection (MTTD) by surfacing issues before they impact end users. Tune the for duration on each alert to balance sensitivity with alert fatigue—5-10 minutes typically provides enough time to distinguish transient issues from genuine problems requiring intervention.
The combination of Hubble’s network-level insights and Prometheus metrics provides comprehensive visibility into cluster operations, enabling rapid incident response and capacity planning. Together, these tools form the observability foundation that makes production Kubernetes manageable at scale.
With observability foundations in place, the next critical piece is automating deployments. In the following section, we’ll build a GitHub Actions pipeline that deploys to DOKS with zero-downtime rollouts and automatic rollback capabilities.
CI/CD Integration: GitHub Actions to DOKS Deployment Pipeline
A production DOKS cluster demands automated, repeatable deployments. GitHub Actions provides a natural fit for DigitalOcean workflows, with native doctl support and seamless DOCR integration. This section walks through a complete pipeline that builds container images, pushes to your registry, and deploys to DOKS—all triggered by a git push.
Configuring DOKS Access in GitHub Actions
GitHub Actions needs two pieces of credential material: a DigitalOcean API token and your cluster’s kubeconfig. Generate a token in the DigitalOcean control panel under API > Tokens/Keys with read and write scopes. Store it as a repository secret named DIGITALOCEAN_ACCESS_TOKEN.
For the cluster name, add CLUSTER_NAME as another secret (or hardcode it in your workflow if you prefer). GitHub Actions will use these to authenticate doctl and configure kubectl context dynamically.
name: Deploy to DOKS
on:  push:    branches: [main]
env:  REGISTRY: registry.digitalocean.com  IMAGE_NAME: my-app  CLUSTER_NAME: production-doks-cluster
jobs:  build-and-deploy:    runs-on: ubuntu-latest    steps:      - name: Checkout code        uses: actions/checkout@v4
      - name: Install doctl        uses: digitalocean/action-doctl@v2        with:          token: ${{ secrets.DIGITALOCEAN_ACCESS_TOKEN }}
      - name: Log in to DigitalOcean Container Registry        run: doctl registry login --expiry-seconds 600
      - name: Build and push Docker image        run: |          docker build -t $REGISTRY/my-registry/$IMAGE_NAME:$GITHUB_SHA .          docker push $REGISTRY/my-registry/$IMAGE_NAME:$GITHUB_SHA
      - name: Save kubeconfig        run: doctl kubernetes cluster kubeconfig save $CLUSTER_NAME
      - name: Deploy to Kubernetes        run: |          kubectl set image deployment/my-app \            my-app=$REGISTRY/my-registry/$IMAGE_NAME:$GITHUB_SHA \            --namespace=production          kubectl rollout status deployment/my-app --namespace=production
This workflow triggers on every push to main. It installs doctl, authenticates against DOCR, builds a Docker image tagged with the git commit SHA, and pushes it to your registry. The doctl kubernetes cluster kubeconfig save command writes a valid kubeconfig to ~/.kube/config, making subsequent kubectl commands target your DOKS cluster.
The --expiry-seconds 600 flag on the registry login ensures your authentication token remains valid for the duration of the build. For workflows with longer build times, increase this value accordingly. The commit SHA tag provides traceability—you can always correlate a running pod back to its source code commit.
GitOps-Style Declarative Deployments
For teams preferring declarative infrastructure, replace the imperative kubectl set image with a Kustomize overlay or Helm chart update. Store your Kubernetes manifests in a k8s/ directory and use kubectl apply to reconcile state:
      - name: Update image tag in manifests        run: |          cd k8s/overlays/production          kustomize edit set image my-app=$REGISTRY/my-registry/$IMAGE_NAME:$GITHUB_SHA
      - name: Apply Kubernetes manifests        run: kubectl apply -k k8s/overlays/production
This approach keeps your deployment configuration in version control alongside application code. Kustomize overlays let you maintain environment-specific variations (staging vs. production) without duplicating YAML. The kustomize edit set image command patches your deployment manifest in-place, updating only the container image reference while preserving other configuration like resource limits, environment variables, and volume mounts.
For Helm users, substitute helm upgrade --install with --set image.tag=$GITHUB_SHA to achieve similar results. The key principle remains: treat infrastructure definitions as code, versioned and reviewed through pull requests just like application changes.
💡 Pro Tip: Use
kubectl waitinstead ofrollout statusfor more granular health checks. Example:kubectl wait --for=condition=available --timeout=300s deployment/my-app -n productionensures pods are actually serving traffic before the workflow exits.
Multi-Environment Workflows
Extend the pipeline to support staging and production environments with branch-based triggers. Configure separate workflows or conditional steps that deploy to a staging cluster on pushes to develop, then require manual approval before promoting to production:
on:  push:    branches: [develop, main]
jobs:  deploy:    runs-on: ubuntu-latest    environment: ${{ github.ref == 'refs/heads/main' && 'production' || 'staging' }}    steps:      # ... build steps ...      - name: Deploy to environment        run: |          NAMESPACE=${{ github.ref == 'refs/heads/main' && 'production' || 'staging' }}          kubectl apply -k k8s/overlays/$NAMESPACE
GitHub’s environment protection rules let you enforce review requirements before production deployments proceed. This pattern balances automation with control—staging deploys continuously, while production requires explicit human approval.
Integrating Registry Garbage Collection
DigitalOcean charges for DOCR storage, so prune stale images regularly. Add a scheduled workflow that runs doctl registry garbage-collection start weekly to reclaim space from untagged manifests. Combine this with image retention policies to keep only the last 10 tagged images per repository.
With this pipeline in place, your deployments become auditable, repeatable, and fully automated. Every commit to main flows through build, test, and deployment stages without manual kubectl commands. This foundation scales to multi-environment workflows with branch-based deployments and automated rollbacks.
Key Takeaways
- Design multi-pool DOKS clusters with separate node pools for system services, applications, and stateful workloads to optimize cost and reliability
- Use doctl for infrastructure-as-code cluster provisioning and integrate DOCR + Block Storage for a fully DigitalOcean-native stack
- Implement a single ingress controller to route all traffic through one load balancer, avoiding the $12/month cost per LoadBalancer service
- Enable Cilium Hubble and deploy Prometheus via 1-Click apps for production observability without manual configuration
- Build GitHub Actions workflows that push to DOCR and deploy to DOKS using service account tokens for secure automation