
eBPF Explained: How the Linux Kernel Extension Model Powers Modern Observability
Your production service is throwing latency spikes, but your APM agent shows nothing unusual. Traces look clean. Custom metrics are flat. The dashboard is green. Meanwhile, p99 latency is creeping up and your on-call rotation is burning through hypotheses.
The bottleneck is in kernel space—network packet processing, scheduler decisions, filesystem I/O, memory reclamation—below the visibility horizon of every tracing library you’ve instrumented. Your APM agent lives in userspace. It sees function calls, HTTP transactions, database queries. It has no idea what the kernel is doing between those events, and in a production system under load, that gap is where latency hides.
This isn’t a tooling failure. It’s a structural limitation of how traditional observability works. Instrumentation libraries wrap userspace code. Syscall tracing gives you kernel visibility, but at a cost: the overhead of capturing every syscall in a high-throughput service collapses performance in exactly the conditions where you need to be watching. Pre-eBPF kernel modules let you run code in kernel space, but a bug doesn’t throw an exception—it panics the host. Nobody ships experimental observability code as a kernel module into production.
eBPF changes the constraint. It lets you attach verified, sandboxed programs directly to kernel hook points—scheduler events, network stack operations, block I/O, arbitrary kprobes—with overhead measured in nanoseconds and zero risk of kernel destabilization. The programs run inside the kernel, see everything the kernel sees, and report back through shared memory structures without the context-switching cost of traditional tracing.
To understand why that matters architecturally, you need to understand what eBPF actually is at the kernel level—and the gap it was designed to fill.
The Observability Gap That eBPF Fills
Production systems fail in ways that application-level monitoring cannot see. A service degrades because the kernel’s TCP retransmit buffer is saturating. A latency spike traces back to scheduler contention between CPU-bound threads. A container mysteriously drops packets due to a cgroup memory limit enforced three layers below your application code. Traditional APM agents—instrumented libraries, language runtimes, sidecar proxies—operate entirely in userspace. They capture what your application does, not what the kernel does on its behalf.

This gap is not a tooling deficiency. It is architectural. Every system call, every network packet, every context switch, every page fault happens in kernel space. Userspace agents observe the shadows these events cast upward: elevated latency, incremented error counters, occasional stack traces. The root cause lives below the instrumentation boundary.
Why Prior Approaches Failed to Bridge the Gap
Engineers have attempted to close this gap before eBPF existed, and each approach carried unacceptable trade-offs.
Kernel modules offered full kernel access. A loadable module runs with the same privilege as the kernel itself, which means a single null pointer dereference crashes the entire host. Deploying custom kernel modules in production requires freezing kernel versions, coordinating with security teams, and accepting that a bug in your observability layer takes down the workloads it was meant to protect. At scale, this is operationally untenable.
Syscall tracing with strace or ptrace required attaching a tracer process to each target, incurring 2–10x overhead under realistic production load due to context switching and stop-world semantics. These tools are invaluable for local debugging and categorically inappropriate for always-on production instrumentation.
Static kernel tracepoints exposed specific, predetermined events but required recompiling the kernel to add new ones and provided no programmable logic for filtering or aggregation at the source.
The fundamental requirement was clear long before eBPF arrived: production systems need programmable kernel visibility that is safe by construction, incurs minimal overhead when idle or filtering, and requires no kernel rebuilds or host restarts to deploy.
eBPF satisfies all three constraints simultaneously—not through compromise, but through a purpose-built kernel extension model that treats safety and performance as non-negotiable. Understanding how that model works requires looking at its architecture from the inside out.
eBPF Architecture: The Kernel’s Safe Extension Model
Traditional kernel extensions—loadable kernel modules—operate with full kernel privileges and zero safety guarantees. A bug in a kernel module corrupts kernel memory, panics the system, or introduces silent security vulnerabilities. This is why production engineers have historically avoided custom kernel instrumentation: the risk profile is simply too high.
eBPF takes a fundamentally different approach. Rather than loading arbitrary native code into kernel space, eBPF programs execute inside a constrained virtual machine embedded in the kernel itself. That distinction—sandboxed VM versus raw kernel code—is what makes eBPF safe to deploy in production without reboots, without kernel patches, and without the operational terror that kernel modules rightfully inspire.
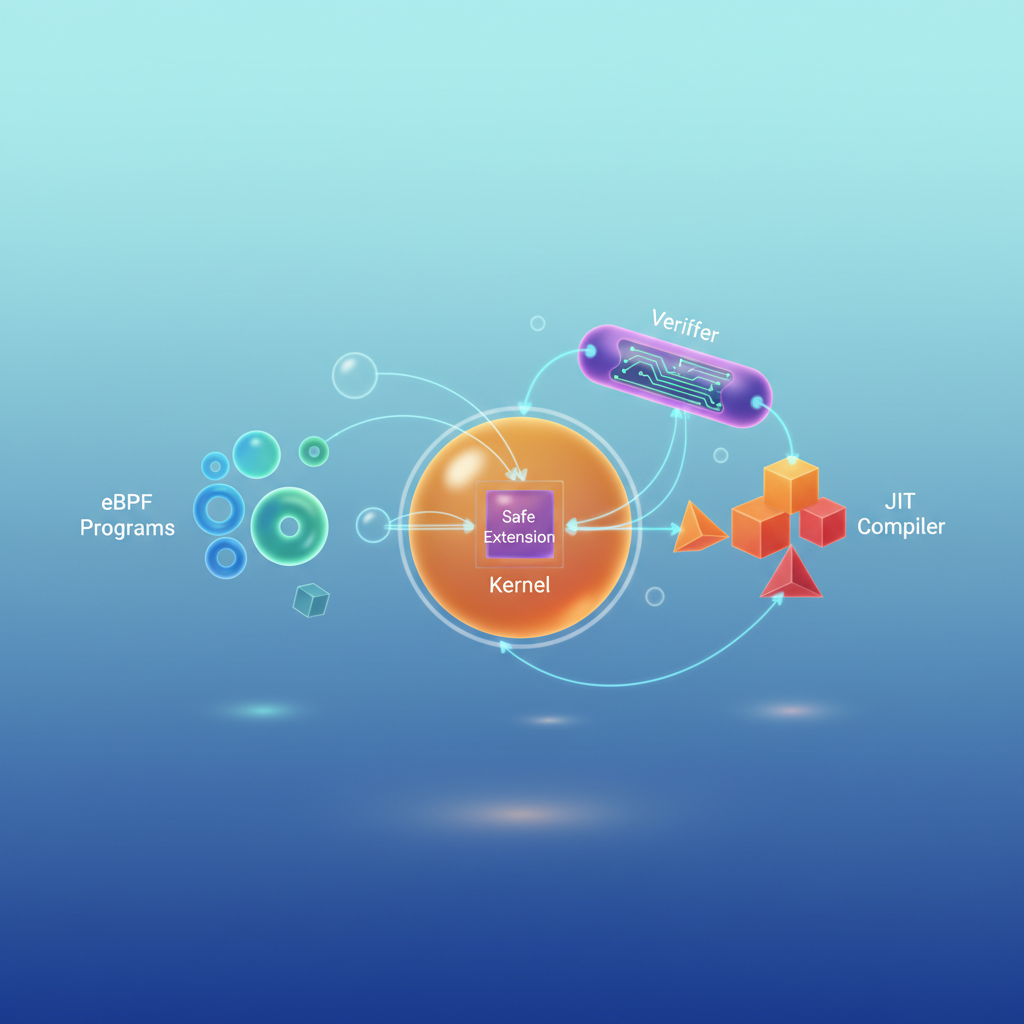
The Three-Stage Pipeline
Every eBPF program follows the same path from source to execution:
Stage 1: Compilation to eBPF bytecode. Developers write eBPF programs in restricted C, which Clang compiles down to eBPF bytecode—a RISC-style instruction set with 11 64-bit registers and a fixed 512-byte stack. This bytecode is architecture-neutral; the same compiled object runs on x86-64, ARM64, or any other Linux-supported architecture.
Stage 2: Verification. Before a single instruction executes, the kernel’s verifier performs exhaustive static analysis on the bytecode. This is the security and safety checkpoint that makes everything else possible.
Stage 3: JIT compilation. Once the verifier signs off, the kernel’s JIT compiler translates eBPF bytecode into native machine instructions for the host CPU architecture. The program is now indistinguishable in execution speed from compiled kernel code.
What the Verifier Actually Enforces
The verifier is not a lightweight lint check—it is a formal analysis engine that traverses every possible execution path through your program. Its guarantees are absolute:
- No unbounded loops. Every loop must have a provably finite iteration bound. Programs that cannot demonstrate termination are rejected outright.
- No invalid memory access. Pointer arithmetic is tracked across the entire call graph. Dereferencing a potentially null pointer, reading past a map value’s boundary, or accessing memory outside the 512-byte stack—all rejected at load time.
- No uninitialized data reads. The verifier tracks register state through every branch. Reading from a register that has not been written on all incoming paths is a verification failure.
- Bounded execution time. Combined with loop restrictions, the verifier ensures programs complete within a deterministic instruction budget.
When verification fails, the kernel returns a detailed log explaining exactly which instruction triggered the rejection and why. That feedback loop makes debugging verification errors tractable, even when the analysis feels opaque at first.
💡 Pro Tip: The verifier’s complexity budget is not infinite. Programs with extremely deep call chains or large numbers of branches can hit the instruction limit (currently one million instructions for privileged programs). If you hit this ceiling, restructure your logic using BPF tail calls to chain multiple programs rather than expanding a single monolithic one.
JIT Performance Characteristics
The JIT compilation step closes the performance gap between eBPF and native kernel code almost entirely. Benchmarks across kernel versions consistently show eBPF programs running at 90–98% of equivalent native kernel code performance, with the remaining overhead attributable to context-switching between kernel and eBPF execution contexts rather than instruction execution itself.
This performance profile is what allows eBPF-based observability tools to run continuously in production—not just during incident investigation windows.
With the execution model established, the next logical question is where eBPF programs actually attach inside the kernel and how they share data with userspace. That is the domain of hook points and maps.
Hook Points and Maps: Where eBPF Programs Live and Communicate
eBPF programs don’t run in a vacuum—they attach to specific kernel execution points and communicate results back to userspace through shared data structures. Choosing the wrong hook point means either missing the data you need or paying an unnecessary performance tax. Understanding the map abstraction determines whether your tooling scales to high-throughput production workloads.
Hook Point Taxonomy
kprobes and kretprobes attach to arbitrary kernel functions at entry and return, respectively. They give you the widest coverage—any exported kernel symbol is fair game—but that breadth comes with a stability cost. Kernel function signatures change between versions, so a kprobe written against do_sys_openat2 on kernel 5.15 requires adjustment on 6.x. Use kprobes when no stable tracepoint covers the behavior you need.
Tracepoints are explicit instrumentation hooks defined in the kernel source under TRACE_EVENT macros. They expose a stable ABI: argument names, types, and ordering are preserved across kernel versions. For common subsystems—syscalls, scheduler events, network packets—tracepoints are the correct default. The sys_enter_openat tracepoint, for example, provides the filename and flags arguments without version-specific offsets.
XDP (eXpress Data Path) hooks fire before the kernel’s networking stack processes a packet—before socket buffers are allocated, before any protocol parsing. This placement enables packet filtering, load balancing, and DDoS mitigation at line rate on commodity hardware. XDP programs return a verdict: XDP_PASS, XDP_DROP, or XDP_TX. The tradeoff is that context is minimal; you’re working with raw frame bytes.
Cgroup hooks (cgroup/connect4, cgroup/skb, and others) attach at the cgroup boundary rather than a global kernel function. This scoping is directly useful for container environments: a single program instance applies selectively to the processes within a cgroup hierarchy, enabling per-namespace policy enforcement without process-level instrumentation.
eBPF Maps: The Kernel-to-Userspace Data Channel
Maps are typed, kernel-resident data structures accessible from both eBPF programs and userspace via file descriptors. Three map types appear in nearly every observability use case:
- BPF_MAP_TYPE_HASH — key/value lookup for aggregating per-process or per-connection counters
- BPF_MAP_TYPE_RINGBUF — a lock-free ring buffer for streaming variable-length events to userspace with minimal overhead; prefer this over the older
perf_event_arrayfor new programs - BPF_MAP_TYPE_PERF_EVENT_ARRAY — per-CPU event channels, still found in mature tooling but superseded by
ringbuffor most workloads
A typical latency histogram program writes bucketed measurements from the kernel side and drains them from a userspace polling loop:
struct {    __uint(type, BPF_MAP_TYPE_HASH);    __uint(max_entries, 4096);    __type(key, u32);       // PID    __type(value, u64);     // accumulated latency in nanoseconds} pid_latency SEC(".maps");
SEC("tracepoint/syscalls/sys_exit_read")int trace_read_exit(struct trace_event_raw_sys_exit *ctx) {    u32 pid = bpf_get_current_pid_tgid() >> 32;    u64 lat = bpf_ktime_get_ns();    bpf_map_update_elem(&pid_latency, &pid, &lat, BPF_ANY);    return 0;}
Tail Calls and Program Chaining
The BPF instruction limit (one million instructions as of kernel 5.2) constrains what a single program can express. Tail calls solve this by allowing one eBPF program to transfer control to another stored in a BPF_MAP_TYPE_PROG_ARRAY—without returning to the caller. The chain consumes no additional stack frames, and the kernel enforces a maximum depth of 33 calls. Production tools like Cilium use tail call chains to implement full L7 protocol parsing across multiple programs.
💡 Pro Tip: Prefer tracepoints over kprobes wherever coverage exists. When you do use kprobes, pin the target symbol by name and add a kernel version guard in your CI pipeline—a broken kprobe fails silently at attach time on a mismatched kernel.
Hook point selection is an architectural decision: tracepoints for portability, kprobes for depth, XDP for network performance, and cgroup hooks for container-scoped policy. Once data flows into maps, userspace tooling can aggregate, forward, or visualize it without any changes to the programs themselves.
With hook points and maps established, the next section walks through a complete working observability program using libbpf—from skeleton generation to reading events in a userspace polling loop.
Writing Your First eBPF Observability Program with libbpf
Modern eBPF development has converged on libbpf as the canonical approach for building production-grade programs. Unlike earlier BCC-based tooling that compiled BPF bytecode at runtime (requiring kernel headers on every target host), libbpf leverages CO-RE (Compile Once, Run Everywhere)—a mechanism that embeds BTF (BPF Type Format) metadata into the compiled object so the loader can relocate struct field offsets at load time. The practical result: you compile once on a CI server and ship a binary that runs correctly across kernel versions 5.4 through 6.x without recompilation or host-side toolchains. This portability is what makes libbpf the right foundation for any observability tooling you intend to operate at scale.
The Kernel-Side Program: Capturing Socket Send Timestamps
The goal is to measure HTTP response latency at the socket layer without touching application code. The entry hook is sock_sendmsg—called every time the kernel sends data through a socket. You record a timestamp on the way in, correlate it with the socket’s file descriptor, and emit a latency sample when the send completes.
#include "vmlinux.h"#include <bpf/bpf_helpers.h>#include <bpf/bpf_tracing.h>
struct event {    __u32 pid;    __u64 delta_ns;    __u8  comm[16];};
struct {    __uint(type, BPF_MAP_TYPE_HASH);    __uint(max_entries, 8192);    __type(key, __u64);   /* socket pointer as correlation key */    __type(value, __u64); /* ktime_ns at entry */} start_times SEC(".maps");
struct {    __uint(type, BPF_MAP_TYPE_RINGBUF);    __uint(max_entries, 1 << 20); /* 1 MB ring buffer */} events SEC(".maps");
SEC("kprobe/sock_sendmsg")int BPF_KPROBE(trace_sendmsg_enter, struct socket *sock, struct msghdr *msg){    __u64 key = (__u64)(unsigned long)sock;    __u64 ts  = bpf_ktime_get_ns();    bpf_map_update_elem(&start_times, &key, &ts, BPF_ANY);    return 0;}
SEC("kretprobe/sock_sendmsg")int BPF_KRETPROBE(trace_sendmsg_exit, int ret){    struct socket *sock = (struct socket *)PT_REGS_PARM1(ctx);    __u64 key = (__u64)(unsigned long)sock;    __u64 *tsp = bpf_map_lookup_elem(&start_times, &key);    if (!tsp) return 0;
    __u64 delta = bpf_ktime_get_ns() - *tsp;    bpf_map_delete_elem(&start_times, &key);
    struct event *e = bpf_ringbuf_reserve(&events, sizeof(*e), 0);    if (!e) return 0;
    e->pid      = bpf_get_current_pid_tgid() >> 32;    e->delta_ns = delta;    bpf_get_current_comm(&e->comm, sizeof(e->comm));    bpf_ringbuf_submit(e, 0);    return 0;}
char LICENSE[] SEC("license") = "GPL";
Two design decisions are worth calling out explicitly. First, the vmlinux.h header—generated from your kernel’s BTF data via bpftool btf dump file /sys/kernel/btf/vmlinux format c—replaces hundreds of individual kernel headers with a single, stable interface that travels with your source tree. Second, the ring buffer map type is preferred over perf buffers for new programs: it provides strong ordering guarantees, avoids per-CPU memory fragmentation, and allows the kernel to drop samples gracefully under backpressure rather than silently corrupting data.
The Userspace Consumer: Polling and Emitting Metrics
Once loaded, the userspace process polls the ring buffer and forwards samples to your metrics pipeline. The Python snippet below illustrates the polling loop and event decoding:
import ctypes, timefrom bcc import BPF  # for skeleton bootstrap only; production uses libbpf-go
class Event(ctypes.Structure):    _fields_ = [("pid", ctypes.c_uint32),                ("delta_ns", ctypes.c_uint64),                ("comm", ctypes.c_char * 16)]
def handle_event(cpu, data, size):    e = ctypes.cast(data, ctypes.POINTER(Event)).contents    latency_ms = e.delta_ns / 1_000_000    print(f"pid={e.pid} comm={e.comm.decode()} latency={latency_ms:.3f}ms")
b = BPF(src_file="http_latency.bpf.c")b["events"].open_ring_buffer(handle_event)
print("Tracing sock_sendmsg latency... Ctrl-C to stop.")while True:    b.ring_buffer_poll()    time.sleep(0.1)
In a Go-based production service, replace this with libbpf-go’s ringbuf.Reader. The idiomatic pattern is to feed each sample into a prometheus.Histogram and expose it on :9090/metrics. The kernel program continues running across application deploys—you gain continuous latency visibility with no changes to the services being measured and no restart required. For high-throughput services, tune the ring buffer size upward (powers of two, in bytes) and reduce the poll interval to minimize event loss under burst load.
Rapid Prototyping with bpftrace
Before committing to a full libbpf program, validate your hypothesis in a single terminal line:
bpftrace -e ' kprobe:sock_sendmsg { @start[arg0] = nsecs; } kretprobe:sock_sendmsg /@start[arg0]/ { @latency_us = hist((nsecs - @start[arg0]) / 1000); delete(@start[arg0]); }'This emits a latency histogram aggregated in-kernel—no userspace data movement until the process exits. bpftrace is the fastest path from hypothesis to data; libbpf is the path from prototype to production. The two tools are complementary: use bpftrace to confirm that sock_sendmsg is the right hook and that your latency distribution looks plausible, then graduate to a libbpf skeleton once you need structured output, Prometheus integration, or program persistence across tool invocations.
Pro Tip: Always set
ulimit -l unlimitedbefore loading eBPF programs in development. The default locked memory limit silently causesEPERMerrors during map allocation that are easy to misattribute to permission issues. Add this to your development container’s entrypoint to eliminate the class of errors entirely.
The full development lifecycle—write kernel C, compile with clang -target bpf, generate skeletons with bpftool gen skeleton, consume events in userspace—completes in under 200 lines of code for most observability use cases, yielding zero-instrumentation visibility into any kernel subsystem your program hooks.
With the development model established, the next question is where eBPF delivers its highest ROI in production environments—and that answer extends well beyond observability into networking and security enforcement.
eBPF in Production: Networking and Security Use Cases
Observability is where most engineers first encounter eBPF, but the technology’s impact on networking and security is equally transformative. The same kernel extension model that powers zero-instrumentation tracing also enables packet processing at line rate, policy enforcement without userspace round-trips, and runtime threat detection with surgical precision.
XDP: Packet Processing Before the Kernel Stack
eXpress Data Path (XDP) attaches eBPF programs at the earliest possible point in the network receive path—before SKB allocation, before the kernel networking stack processes anything. This placement enables packet decisions in the range of tens of nanoseconds per packet on modern NICs with driver-level XDP support.
The practical consequence is DDoS mitigation that operates at a scale iptables cannot reach. A syn-flood or UDP amplification attack that would saturate iptables rule traversal gets dropped at the driver before it consumes kernel memory or CPU scheduling time. Cloudflare has documented dropping over 1 Tbps of attack traffic using XDP-based programs running on commodity hardware.
Load balancing benefits from the same architecture. Cilium’s kube-proxy replacement implements Kubernetes Service routing entirely through XDP and TC (traffic control) eBPF programs. Instead of iptables chains that grow linearly with cluster size, service endpoint lookups become O(1) hash table operations against eBPF maps. At 10,000 services, the difference between iptables and eBPF-based routing is measurable in both latency and CPU utilization.
Network Policy Without iptables Overhead
Traditional Kubernetes network policy runs through Netfilter and iptables. Each additional policy rule extends a chain that every packet traverses sequentially. eBPF-based policy enforcement replaces this with map lookups: a packet’s source identity maps to an allowed-destination bitmap, resolved in constant time regardless of policy count.
Cilium encodes workload identity directly into network packets using a concept called security identities, assigning each Kubernetes workload a numeric label derived from its pod metadata. Policy enforcement then operates on identities rather than IP addresses, which remain ephemeral in containerized environments. This model survives pod restarts and IP reuse without policy gaps.
Runtime Security and Syscall Filtering
seccomp-BPF has been the standard mechanism for syscall filtering in container runtimes since Linux 3.17. Docker and containerd both apply seccomp profiles via BPF programs that filter syscalls before they enter kernel handlers—a capability that predates the eBPF ecosystem but shares the same bytecode execution model.
Beyond filtering, tools like Tetragon (from the Cilium project) and Falco attach eBPF programs to LSM hooks and kprobes to detect behavioral anomalies at runtime: unexpected execve calls, /etc/shadow reads from non-root processes, or outbound connections from processes that have never made network calls. Unlike audit-log-based detection, these programs run synchronously in kernel context and can enforce policy by sending SIGKILL before a syscall completes.
💡 Pro Tip: Tetragon’s
TracingPolicyCRD lets you define detection rules as Kubernetes-native YAML that maps directly to kernel hook configurations—no kernel module compilation or node SSH access required.
Cilium serves as the reference architecture that integrates these capabilities: XDP-based load balancing, identity-aware network policy, and Tetragon-powered runtime security running from a single DaemonSet. Understanding that architecture informs how to evaluate the growing field of eBPF-native observability platforms, which is where the next section turns.
Evaluating eBPF-Based Observability Platforms
Choosing an eBPF observability solution requires evaluating more than marketing claims. The underlying implementation details—kernel compatibility, portability strategy, and deployment model—determine whether a tool will actually work in your environment and at your scale.
Agentless Architecture vs. Traditional Instrumentation
Traditional observability agents run as sidecars or DaemonSets that require per-pod instrumentation, language-specific runtimes, and manual SDK integration. eBPF sensors run as a single kernel-level process per node, intercepting system calls and network events across every container on the host without modifying workloads. This eliminates the instrumentation surface entirely: no restarts to inject agents, no language runtime compatibility matrix to maintain, no per-service configuration drift.
The overhead difference is measurable. eBPF-based observability typically adds 1–3% CPU overhead at the node level. Traditional sidecar agents, by contrast, impose 5–15% overhead per instrumented service—costs that compound as service counts grow.
What to Validate Before Adopting
Kernel version requirements are the first gate. Most production eBPF features require kernel 4.18 or later. Ring buffers—the preferred high-throughput event transport—require 5.8+. Before evaluating any tool, audit your fleet’s kernel distribution. GKE, EKS, and AKS default node images all ship kernels that satisfy these requirements, but self-managed or legacy fleets warrant explicit verification.
CO-RE support determines whether programs are compiled once and run across kernel versions, or whether they require per-node recompilation via BCC’s LLVM dependency. Tools built on libbpf with BTF-enabled kernels (5.2+) support CO-RE natively. Anything requiring BCC at runtime introduces a significant operational dependency you want to avoid in production.
The Tooling Landscape
| Tool | Best For | Production-Ready |
|---|---|---|
| BCC | Rapid prototyping, one-off diagnostics | No |
| bpftrace | Ad-hoc kernel tracing, one-liners | No |
| libbpf | Building production-grade eBPF programs | Yes |
| groundcover | Zero-config Kubernetes observability with auto-instrumented APM, metrics, and logs | Yes |
For teams building custom tooling, libbpf is the right foundation. For teams that need production observability without an eBPF engineering investment, platforms like groundcover deploy a single eBPF sensor per node and surface OpenTelemetry-compatible signals across your entire Kubernetes cluster with no application changes.
💡 Pro Tip: Validate CO-RE compatibility by checking whether your candidate tool ships pre-compiled BPF object files or requires LLVM at runtime. The presence of
clangorllvmin the tool’s container image is a reliable indicator of a non-CO-RE implementation.
With the evaluation framework clear, the next step is translating it into a concrete adoption path—starting with read-only tracing on non-critical workloads and progressively expanding coverage as your team builds eBPF operational confidence.
Getting Started: A Practical eBPF Adoption Path
Adopting eBPF does not require a full platform commitment on day one. The path from zero to production-grade observability follows a clear progression: validate kernel capabilities, experiment with one-liners, graduate to structured programs, then evaluate managed tooling if the operational overhead justifies it.
Step 1: Audit Your Kernel
Before writing a single line of eBPF code, confirm your kernel supports the program types you need. Linux 5.8+ covers the vast majority of production use cases, including BPF ring buffers and fentry/fexit trampolines.
## Check kernel versionuname -r
## List supported program types and available mapsbpftool feature probe kernel | grep prog_typebpftool feature probe kernel | grep map_type
## Inspect any currently loaded eBPF programsbpftool prog list
On kernels below 5.4, expect limited CO-RE support and no ring buffer maps. Kernels below 4.9 lack socket filter improvements that most modern tooling depends on.
Step 2: Validate Visibility with bpftrace
Before committing to libbpf or any managed platform, use bpftrace to verify you can reach the kernel subsystems you care about. These one-liners run in seconds and confirm both privilege and hook availability.
## Trace all new process executions with latencybpftrace -e 'tracepoint:syscalls:sys_enter_execve { printf("%s\n", comm); }'
## Measure TCP connection latency in microsecondsbpftrace -e 'kprobe:tcp_v4_connect { @start[tid] = nsecs; }             kretprobe:tcp_v4_connect { @latency_us = (nsecs - @start[tid]) / 1000; delete(@start[tid]); }'
## Count syscalls by process namebpftrace -e 'tracepoint:raw_syscalls:sys_enter { @[comm] = count(); }'
💡 Pro Tip: If
bpftraceprobes fail with permission errors, verify that the process runs as root or holdsCAP_BPF+CAP_PERFMON. From Linux 5.8 onward, these two capabilities replace the blanketCAP_SYS_ADMINrequirement for most BPF operations—a meaningful security improvement for containerized environments.
Step 3: Migrate to libbpf for Production Programs
Once your bpftrace experiments confirm the kernel hooks exist and return useful data, replace ad-hoc scripts with structured libbpf programs. libbpf with CO-RE (Compile Once, Run Everywhere) compiles against BTF type information, eliminating per-kernel rebuilds and making programs portable across your fleet.
From there, evaluate managed platforms—Cilium, Pixie, or Parca—against the cost of maintaining custom programs. The right inflection point is when your observability requirements exceed what composable bpftrace scripts deliver but your team lacks bandwidth to own the full eBPF program lifecycle.
With the adoption path mapped, the final consideration is where eBPF fits within your broader observability strategy alongside existing metrics pipelines and distributed tracing infrastructure.
Key Takeaways
- Audit your kernel version first—run
bpftool prog listand check for 5.8+ to unlock ring buffers and CO-RE support before designing any eBPF-based observability pipeline - Use bpftrace one-liners to prototype and validate hook points before investing in a full libbpf program; treat bpftrace as the eBPF equivalent of a shell script
- Choose hook points based on stability needs: tracepoints over kprobes for production programs, XDP over TC for maximum network performance, cgroup hooks for container-scoped visibility in Kubernetes
- Evaluate agentless eBPF platforms (Cilium, groundcover, Tetragon) against your kernel version floor and privilege model before building custom programs—the ecosystem has matured significantly