Building Your First Event-Driven Pipeline with Argo Events: From Webhook to Workflow
Your team just shipped a new microservice. The code is clean, the tests pass, and the deployment went smoothly. Now comes the part nobody warned you about: connecting everything together. GitHub pushes need to trigger builds. Slack messages should kick off deployments. S3 uploads have to start data pipelines. And somehow, all of this needs to happen automatically, reliably, and without you writing yet another custom webhook handler or maintaining a polling service that wakes up every 30 seconds to ask “anything new?”
You’ve been here before. Maybe you wrote a quick script that polls an API endpoint. Maybe you spun up a small service just to receive webhooks and forward them to your CI system. These solutions work—until they don’t. The polling script misses events during network blips. The webhook handler becomes a single point of failure. The “temporary” glue code turns into tribal knowledge that only two people on the team understand.
This is the problem Argo Events was built to solve. Instead of scattering event-handling logic across custom scripts and one-off services, Argo Events gives you Kubernetes-native primitives for capturing events from dozens of sources and routing them to actions—whether that’s triggering an Argo Workflow, scaling a deployment, or hitting an arbitrary HTTP endpoint. It’s declarative, it’s observable, and it runs where your workloads already live.
But before we dive into building our first event-driven pipeline, it’s worth understanding why the traditional approach falls short—and what changes when you stop polling and start listening.
The Polling Problem: Why Event-Driven Beats Constant Checking
Every minute, across thousands of Kubernetes clusters, CI/CD systems ask the same question: “Did anything change?” They check Git repositories, scan container registries, query APIs—and most of the time, the answer is no. This polling pattern, while simple to implement, creates a hidden tax on infrastructure and developer experience.
The Cost of Constant Checking
Traditional automation relies on two primary trigger mechanisms: scheduled polling and manual intervention. A typical Jenkins or GitLab CI setup polls source control every 60 seconds. Multiply that across dozens of repositories and you have hundreds of unnecessary API calls per minute. Beyond the raw resource consumption, polling introduces inherent latency—your deployment waits for the next poll cycle rather than responding immediately to a push.
The math works against you at scale. A platform team managing 100 repositories with 60-second polling intervals generates 144,000 API calls daily just to detect changes. Each call consumes compute cycles, network bandwidth, and API rate limits that could serve actual work.
Inverting the Model
Event-driven architecture eliminates this waste by reversing the relationship. Instead of asking “did something change?”, systems announce “something changed.” The consumer remains idle until notified, responding in milliseconds rather than waiting for the next poll window.
This inversion delivers three immediate benefits:
- Reduced latency: Actions trigger within seconds of the originating event, not minutes
- Lower resource consumption: No wasted cycles checking for non-existent changes
- Cleaner separation of concerns: Event producers don’t need to know about consumers
The pattern isn’t new—message queues and pub/sub systems have powered distributed applications for decades. What’s changed is bringing this model natively into Kubernetes.
Where Argo Events Fits
Argo Events provides the missing event-driven primitives for Kubernetes. Rather than building custom webhook handlers, polling infrastructure, or message queue integrations, platform teams get a declarative framework for connecting external events to cluster actions.
The project operates as a first-class Kubernetes controller, using Custom Resource Definitions to express event sources, routing logic, and trigger actions. A GitHub webhook, an S3 upload, a Kafka message, or a simple cron schedule—all become events that flow through the same unified system.
💡 Pro Tip: Argo Events integrates naturally with Argo Workflows but remains independent. You can trigger any Kubernetes resource, custom script, or HTTP endpoint.
Understanding the core abstractions makes the difference between fighting the system and leveraging it effectively. Let’s examine the three building blocks that make event-driven automation work in Kubernetes.
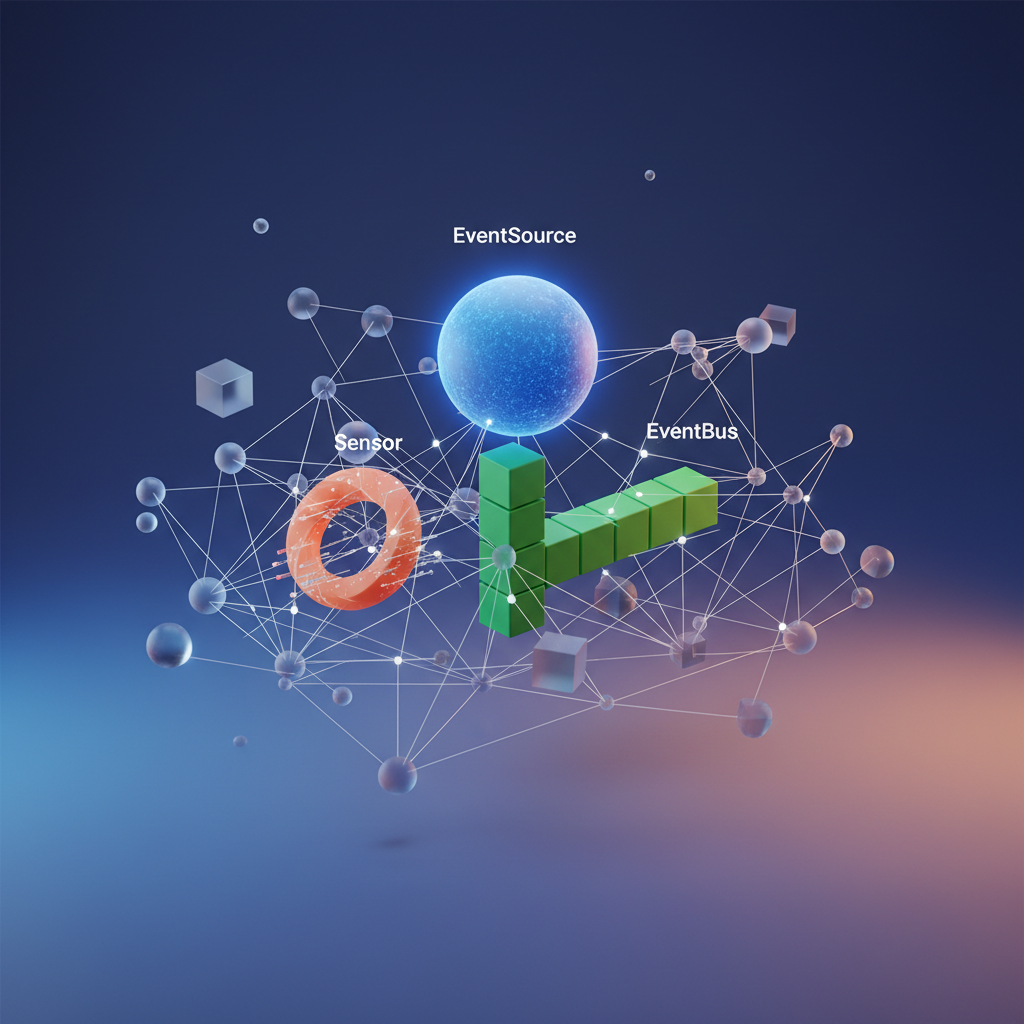
The Three Pillars: EventSource, Sensor, and EventBus
Understanding Argo Events requires grasping three fundamental components that work together to form a complete event-driven pipeline. Each component has a distinct responsibility, and this separation of concerns is what makes Argo Events both flexible and production-ready.
EventSource: The Ingestion Layer
An EventSource defines where your events originate. It’s a Kubernetes custom resource that specifies the type of event, connection details, and any authentication required to receive events from external systems.
Argo Events supports over 20 event source types out of the box. Webhooks let you receive HTTP callbacks from services like GitHub, GitLab, or any system that can send an HTTP POST. Message queues including Kafka, NATS, AWS SQS, and RabbitMQ allow integration with existing messaging infrastructure. Cloud-native sources cover AWS SNS, Google Cloud Pub/Sub, and Azure Event Hubs. You can also use resource events to watch Kubernetes resources directly, calendar-based triggers for scheduled events, and file watchers to monitor storage systems.
When you deploy an EventSource, Argo Events creates the necessary infrastructure automatically—a deployment to run the event listener, a service to expose it (for webhook types), and the logic to normalize incoming events into a standard format.
Sensor: The Decision Engine
A Sensor subscribes to events and decides what actions to take when specific conditions are met. It contains two key elements: dependencies that define which events to listen for, and triggers that specify what happens when those events arrive.
Dependencies can match on event source name, event type, and even filter on event data using JSONPath expressions. This filtering capability means a single Sensor can react differently to different events from the same source—for example, triggering a production deployment only when a GitHub push targets the main branch.
Triggers define the actual work. The most common trigger type creates Argo Workflow resources, but Sensors can also invoke AWS Lambda functions, send HTTP requests, create Kubernetes resources, publish to Slack, or execute custom container images.
EventBus: The Reliable Backbone
The EventBus sits between EventSources and Sensors, providing durable message transport. Without it, EventSources would need direct connections to every Sensor interested in their events—a coupling that doesn’t scale.
The EventBus uses NATS Streaming or NATS JetStream under the hood, giving you message persistence, at-least-once delivery guarantees, and the ability to replay events if a Sensor goes down temporarily. Multiple EventSources publish to the same bus, and multiple Sensors subscribe independently.
💡 Pro Tip: Deploy your EventBus before creating EventSources or Sensors. Both components require a running EventBus to function, and they’ll fail to become ready without one.
Why the Separation Matters
This three-component architecture enables independent scaling and failure isolation. You can run multiple replicas of an EventSource for high-availability webhook ingestion without affecting your Sensors. Sensors can be updated or redeployed without dropping incoming events—the EventBus buffers them. Teams can own different Sensors that react to the same events without coordinating deployments.
The architecture also supports organizational boundaries. A platform team can manage EventSources and the EventBus as shared infrastructure, while application teams define their own Sensors to trigger team-specific workflows.
With this mental model in place, let’s get these components running in your cluster.
Setting Up Argo Events in Your Cluster
A working Argo Events installation requires three components: the controller that manages EventSources and Sensors, the EventBus for message transport, and appropriate RBAC permissions. This section walks through setting up each component with production-ready defaults, covering common pitfalls and configuration decisions you’ll encounter along the way.
Installing the Core Components
The fastest path to a working installation uses the official manifests. Create a dedicated namespace and apply the controller resources:
kubectl create namespace argo-eventskubectl apply -f https://raw.githubusercontent.com/argoproj/argo-events/stable/manifests/install.yamlFor teams preferring Helm, the Argo project maintains an official chart that provides additional configuration flexibility:
helm repo add argo https://argoproj.github.io/argo-helmhelm repo updatehelm install argo-events argo/argo-events -n argo-events --create-namespaceThe Helm installation accepts values for resource limits, node selectors, and tolerations—useful when running in resource-constrained environments or dedicating specific nodes to event processing infrastructure.
Verify the controller is running before proceeding:
kubectl -n argo-events get pods -l app.kubernetes.io/name=controller-managerThe controller pod should reach Running status within a minute. If it remains in Pending, check for resource constraints or missing image pull secrets.
Configuring the EventBus
The EventBus provides the messaging backbone connecting EventSources to Sensors. While Argo Events supports multiple backends including NATS Streaming (deprecated) and Kafka, NATS JetStream offers the best balance of reliability and operational simplicity for production workloads. JetStream provides at-least-once delivery guarantees and persistent storage, ensuring events survive pod restarts.
apiVersion: argoproj.io/v1alpha1kind: EventBusmetadata: name: default namespace: argo-eventsspec: jetstream: version: "2.9.21" replicas: 3 persistence: storageClassName: standard accessMode: ReadWriteOnce volumeSize: 10GiThe three-replica configuration ensures high availability—JetStream maintains quorum even if one node fails. Adjust volumeSize based on your expected event throughput and retention requirements.
Apply this configuration and wait for the StatefulSet to become ready:
kubectl apply -f eventbus.yamlkubectl -n argo-events rollout status statefulset eventbus-default-js💡 Pro Tip: The EventBus named
defaultis automatically used by EventSources and Sensors in the same namespace unless you explicitly specify a different bus. Stick with this naming convention to reduce configuration overhead.
RBAC and Service Accounts
EventSources and Sensors need permissions to interact with cluster resources. The principle of least privilege applies here—grant only the permissions your specific triggers require. The following example covers common use cases including workflow creation:
apiVersion: v1kind: ServiceAccountmetadata: name: argo-events-sa namespace: argo-events---apiVersion: rbac.authorization.k8s.io/v1kind: Rolemetadata: name: argo-events-role namespace: argo-eventsrules: - apiGroups: ["argoproj.io"] resources: ["workflows", "workflowtemplates"] verbs: ["create", "get", "list"] - apiGroups: [""] resources: ["pods", "configmaps", "secrets"] verbs: ["get", "list", "watch"]---apiVersion: rbac.authorization.k8s.io/v1kind: RoleBindingmetadata: name: argo-events-role-binding namespace: argo-eventsroleRef: apiGroup: rbac.authorization.k8s.io kind: Role name: argo-events-rolesubjects: - kind: ServiceAccount name: argo-events-sa namespace: argo-eventsFor cross-namespace triggers, you’ll need ClusterRole and ClusterRoleBinding resources instead. However, start with namespace-scoped permissions and expand only when necessary.
Verifying Your Installation
Run a quick health check to confirm all components are operational:
kubectl -n argo-events get eventbus,eventsource,sensorYou should see the default EventBus with status Running. The EventSource and Sensor lists will be empty until you create your first pipeline.
Check the controller logs for any configuration warnings:
kubectl -n argo-events logs -l app.kubernetes.io/name=controller-manager --tail=50Look for successful reconciliation messages and absence of error-level logs. Common issues at this stage include missing CRDs (if using an older manifest version) or EventBus pods failing to schedule due to PersistentVolume provisioning problems.
With the infrastructure in place, you’re ready to build your first event-driven pipeline. The next section demonstrates connecting a GitHub webhook to trigger actions in your cluster.
Building a GitHub Webhook Pipeline
With Argo Events installed and your EventBus running, you’re ready to build something practical: a pipeline that automatically triggers builds when code is pushed to your repository. This pattern forms the backbone of event-driven CI/CD and demonstrates how EventSources and Sensors work together in production.
Creating the Webhook EventSource
The webhook EventSource exposes an HTTP endpoint inside your cluster that receives GitHub push events. This component acts as the entry point for all incoming webhook traffic, translating HTTP requests into CloudEvents that flow through your EventBus to downstream Sensors.
Start by deploying this EventSource:
apiVersion: argoproj.io/v1alpha1kind: EventSourcemetadata: name: github-webhook namespace: argo-eventsspec: service: ports: - port: 12000 targetPort: 12000 webhook: github-push: port: "12000" endpoint: /push method: POSTApply it with kubectl apply -f github-eventsource.yaml. The EventSource controller creates a Deployment running the webhook server and a corresponding Service that listens on port 12000. You can verify the resources were created successfully:
kubectl get eventsources -n argo-eventskubectl get pods -n argo-events -l eventsource-name=github-webhookYou need to expose this endpoint externally so GitHub can reach it—either through an Ingress or a LoadBalancer Service. The Ingress approach provides more flexibility for routing and TLS termination:
apiVersion: networking.k8s.io/v1kind: Ingressmetadata: name: github-webhook-ingress namespace: argo-events annotations: nginx.ingress.kubernetes.io/ssl-redirect: "true"spec: ingressClassName: nginx rules: - host: webhooks.mycompany.io http: paths: - path: /push pathType: Exact backend: service: name: github-webhook-eventsource-svc port: number: 12000 tls: - hosts: - webhooks.mycompany.io secretName: webhook-tlsNote that Argo Events automatically names the Service by appending -eventsource-svc to your EventSource name. This naming convention is important when configuring your Ingress backend.
Configuring GitHub
In your GitHub repository, navigate to Settings → Webhooks → Add webhook. Configure it with:
- Payload URL:
https://webhooks.mycompany.io/push - Content type:
application/json - Secret: Leave empty for now (we’ll add authentication in the production patterns section)
- Events: Select “Just the push event”
GitHub sends a test ping immediately after you save the webhook configuration. Check the EventSource pod logs to confirm receipt:
kubectl logs -n argo-events -l eventsource-name=github-webhookYou should see log entries indicating the ping was received. If the logs show connection errors or the webhook delivery fails on the GitHub side, verify your Ingress is correctly configured and that DNS resolves properly to your cluster’s ingress controller.
Writing a Filtered Sensor
Raw push events fire for every branch and every repository configured to use your webhook. Without filtering, you’d trigger builds for documentation updates, experimental branches, and repositories you don’t care about. The Sensor filters these events and triggers actions only when specific conditions are met, giving you precise control over what actually initiates your CI pipeline.
apiVersion: argoproj.io/v1alpha1kind: Sensormetadata: name: github-build-sensor namespace: argo-eventsspec: dependencies: - name: push-dep eventSourceName: github-webhook eventName: github-push filters: data: - path: body.ref type: string value: - "refs/heads/main" - "refs/heads/release/*" - path: body.repository.full_name type: string value: - "myorg/backend-api" triggers: - template: name: build-trigger k8s: operation: create source: resource: apiVersion: batch/v1 kind: Job metadata: generateName: build-backend- namespace: ci spec: ttlSecondsAfterFinished: 3600 template: spec: containers: - name: build image: myregistry.io/build-runner:v2.1.0 env: - name: COMMIT_SHA value: "" - name: BRANCH value: "" - name: REPO value: "" restartPolicy: Never parameters: - src: dependencyName: push-dep dataKey: body.after dest: spec.template.spec.containers.0.env.0.value - src: dependencyName: push-dep dataKey: body.ref dest: spec.template.spec.containers.0.env.1.value - src: dependencyName: push-dep dataKey: body.repository.full_name dest: spec.template.spec.containers.0.env.2.valueThe filters block ensures the trigger fires only for pushes to main or any release/* branch in the myorg/backend-api repository. Multiple values in the value array create an OR condition—the filter passes if any value matches. The wildcard pattern in refs/heads/release/* matches any release branch, such as release/v1.0 or release/hotfix-auth.
The parameters section extracts data from the event payload and injects it into the Job specification. The body.after field contains the commit SHA after the push, body.ref holds the full branch reference, and body.repository.full_name provides the organization and repository name. These become environment variables available to your build script, allowing it to check out the correct code revision.
💡 Pro Tip: Use
kubectl get sensors -n argo-eventsand check theSTATUScolumn. A healthy Sensor showsActive. If it’s stuck onInactive, the EventBus connection failed—verify your EventBus pods are running.
Apply the Sensor and push a commit to main. Within seconds, you’ll see a new Job spin up in the ci namespace, receiving the exact commit information from the push event. Monitor the Job creation with:
kubectl get jobs -n ci -wThis pattern—webhook EventSource, filtered Sensor, parameterized trigger—handles straightforward CI scenarios effectively. But Kubernetes Jobs have limitations: no DAG support, no artifact passing, no retries with backoff. For complex build pipelines, you want Argo Workflows as your trigger target instead.
Connecting Argo Events to Argo Workflows
The Kubernetes trigger we built in the previous section works well for simple tasks, but real-world automation demands more. You need conditional logic, parallel execution, artifact passing, and retry policies. This is where Argo Workflows enters the picture.
Argo Workflows is a container-native workflow engine that orchestrates complex multi-step pipelines as Kubernetes resources. When combined with Argo Events, you get a powerful event-driven automation platform that can handle everything from CI/CD pipelines to data processing jobs. The integration between these two projects is seamless—both use the same CustomResourceDefinition patterns and share a common design philosophy around declarative, GitOps-friendly configuration.
The Workflow Trigger
Instead of creating a raw Pod, we configure our Sensor to submit a Workflow resource. Here’s how to modify our GitHub webhook pipeline:
apiVersion: argoproj.io/v1alpha1kind: Sensormetadata: name: github-workflow-sensor namespace: argo-eventsspec: dependencies: - name: github-push eventSourceName: github-eventsource eventName: webapp-repo triggers: - template: name: trigger-build-workflow argoWorkflow: operation: submit source: resource: apiVersion: argoproj.io/v1alpha1 kind: Workflow metadata: generateName: build-and-deploy- spec: entrypoint: main arguments: parameters: - name: repo-url - name: commit-sha - name: branch serviceAccountName: workflow-sa templates: - name: main steps: - - name: checkout template: git-clone - - name: test template: run-tests - - name: build template: docker-build - name: git-clone container: image: alpine/git:2.43.0 command: [git, clone, "{{workflow.parameters.repo-url}}"] - name: run-tests container: image: node:20-alpine command: [npm, test] - name: docker-build container: image: gcr.io/kaniko-project/executor:v1.19.0 args: - --dockerfile=Dockerfile - --destination=registry.example.com/webapp:{{workflow.parameters.commit-sha}} parameters: - src: dependencyName: github-push dataKey: body.repository.clone_url dest: spec.arguments.parameters.0.value - src: dependencyName: github-push dataKey: body.after dest: spec.arguments.parameters.1.value - src: dependencyName: github-push dataKey: body.ref dest: spec.arguments.parameters.2.valueThe argoWorkflow trigger type tells the Sensor to interact with the Argo Workflows controller rather than creating generic Kubernetes resources. The operation: submit directive creates a new Workflow instance each time an event matches. Alternative operations include resubmit for re-running failed workflows and suspend/resume for controlling running workflows.
The parameters section performs the critical work of extracting event data and injecting it into your workflow. Each parameter maps a JSONPath expression from the event payload to a specific location in the workflow spec using dest.
Passing Event Data
The parameter mapping syntax follows a straightforward pattern:
src.dependencyNamereferences the dependency that produced the eventsrc.dataKeyspecifies the JSONPath to extract from the event payloaddestidentifies where to inject the value in your workflow resource
You can access nested fields with dot notation (body.repository.owner.login) and array elements with bracket notation (body.commits.0.message). For deeply nested structures, the full JSONPath specification is supported, including filters and recursive descent when needed.
💡 Pro Tip: Use
dataTemplateinstead ofdataKeywhen you need to transform event data. It accepts Go templating:dataTemplate: "refs/heads/{{ .Input.body.ref | replace \"refs/heads/\" \"\" }}"strips therefs/heads/prefix from branch names.
When to Use Each Trigger Type
Choose your trigger type based on complexity requirements:
| Requirement | K8s Trigger | Workflow Trigger |
|---|---|---|
| Single container execution | ✓ | Overkill |
| Multi-step pipelines | Limited | ✓ |
| Conditional branching | No | ✓ |
| Artifact passing between steps | No | ✓ |
| Retry policies per step | No | ✓ |
| DAG-based execution | No | ✓ |
For quick scripts or single-container jobs, the standard Kubernetes trigger keeps things simple. Once you need steps that depend on each other, parallel fan-out, or sophisticated error handling, Argo Workflows justifies its additional complexity. The workflow trigger also provides better observability through the Argo Workflows UI, where you can visualize execution graphs and inspect logs for each step.
Chaining Events from Workflow Outputs
Workflows can emit events upon completion, creating event chains that enable sophisticated automation patterns. Configure your Workflow with an onExit handler that posts to another EventSource, or use the Argo Events workflow EventSource type to listen for workflow completion events directly. This second approach requires no modification to your workflows—the EventSource watches the Kubernetes API for Workflow status changes and emits events when workflows reach terminal states.
This chaining capability enables patterns like triggering deployment workflows after successful builds, sending notifications on failure, or initiating downstream data processing once upstream jobs complete. Each workflow in the chain remains independently testable and reusable.
With your events now triggering sophisticated workflows, you’ll inevitably need to understand what’s happening when things go wrong. Let’s examine the debugging and observability tools that make Argo Events production-ready.
Debugging and Observability
Event-driven systems introduce a new debugging challenge: tracing invisible events through multiple components. When a webhook fires but no workflow starts, you need systematic techniques to identify where the chain broke. Unlike traditional request-response debugging where you can trace a single HTTP call, event-driven architectures require correlating logs across EventSources, the EventBus, and Sensors to reconstruct what happened.
Tracing Event Flow Through Logs
Start debugging by following the event’s path through your pipeline. Each component produces logs that reveal its current state and any errors encountered. The key is understanding the sequence: EventSource receives the external trigger, publishes to EventBus, and Sensor subscribes and acts.
## Check EventSource logs for incoming eventskubectl logs -l eventsource-name=github-webhook -n argo-events --tail=100
## Verify Sensor received and processed eventskubectl logs -l sensor-name=github-sensor -n argo-events --tail=100
## Inspect EventBus for message delivery issueskubectl logs -l eventbus-name=default -n argo-events --tail=50
EventSource logs show HTTP requests arriving and events being published. Look for entries indicating successful webhook validation and event emission. Sensor logs reveal dependency resolution and trigger execution—you should see messages confirming event receipt and workflow creation attempts. When events vanish between components, the EventBus logs expose message delivery failures, often caused by NATS cluster issues or resource exhaustion.
Common Failure Modes
Three issues account for most Argo Events problems:
RBAC misconfiguration prevents Sensors from creating workflows. The Sensor’s service account needs explicit permissions to create resources in the target namespace. This failure mode is particularly frustrating because the Sensor receives events successfully but silently fails to trigger workflows:
## Verify the sensor can create workflowskubectl auth can-i create workflows \ --as=system:serviceaccount:argo-events:argo-events-sa \ -n argo-workflowsWebhook secret mismatches cause EventSources to reject legitimate requests. GitHub signs payloads with your configured secret, and any discrepancy results in silent drops. Check your Secret exists and matches your GitHub webhook configuration exactly. Use kubectl get secret to verify the secret exists, then compare the base64-decoded value against your GitHub settings.
EventBus connectivity failures happen when NATS pods restart or network policies block inter-pod communication. Verify all EventBus pods are running and that your NetworkPolicies allow traffic on port 4222. Symptoms include EventSources successfully receiving webhooks but Sensors never triggering.
Inspecting Event State
Custom resources store valuable debugging information in their status fields. These provide point-in-time snapshots that complement streaming logs:
## View EventSource status and connection statekubectl get eventsource github-webhook -n argo-events -o yaml | yq '.status'
## Check Sensor dependency statuskubectl describe sensor github-sensor -n argo-events | grep -A 20 "Status:"
## List recently triggered workflows with their event sourceskubectl get workflows -n argo-workflows --sort-by=.metadata.creationTimestamp -l events.argoproj.io/sensor=github-sensor
The status fields reveal connection states, last event timestamps, and error counts. Cross-reference workflow labels with Sensor names to confirm which events successfully triggered executions.
💡 Pro Tip: Add the
--previousflag tokubectl logswhen pods have restarted. Crash loops often hide the root cause in the previous container’s logs.
Prometheus Integration
Argo Events exposes metrics on port 7777 by default. These metrics integrate with your existing Prometheus infrastructure, providing quantitative insight that complements qualitative log analysis. Configure your Prometheus ServiceMonitor to scrape these endpoints:
## Port-forward to check available metricskubectl port-forward svc/github-webhook-eventsource-svc 7777:7777 -n argo-events
## Query metrics endpointcurl -s localhost:7777/metrics | grep argo_events
Key metrics include argo_events_event_processing_duration_seconds for latency tracking and argo_events_events_sent_total for throughput monitoring. Alert on argo_events_event_processing_errors_total to catch failures before users report missing workflows. Consider creating Grafana dashboards that correlate these metrics with your workflow execution rates to identify bottlenecks.
With observability in place, you can confidently move from development to production—but production deployments require additional patterns to ensure reliability at scale.
Production Patterns and Pitfalls
Moving from a working Argo Events setup to a production-grade deployment requires attention to scaling, reliability, and security. This section covers the patterns that prevent 3 AM pages and the antipatterns that cause them.
Scaling EventSources for High Throughput
A single EventSource pod becomes a bottleneck under heavy load. For high-throughput scenarios—processing thousands of webhook calls per minute—deploy multiple EventSource replicas behind a Kubernetes Service. The EventBus handles deduplication, so you can scale horizontally without worrying about duplicate event processing.
For bursty workloads, configure Horizontal Pod Autoscalers on your EventSource deployments. Monitor the argo_events_eventsource_events_count metric to set appropriate scaling thresholds. Keep replica counts odd (3, 5, 7) to maintain quorum during leader election.
Event Replay and Delivery Guarantees
Argo Events provides at-least-once delivery semantics by default. Your Sensors receive every event at least once, but duplicates occur during EventBus failovers or network partitions. Design your triggered Workflows to be idempotent—processing the same event twice should produce the same result without side effects.
For scenarios requiring exactly-once semantics, implement deduplication at the Workflow level. Use event metadata (like a GitHub delivery ID or commit SHA) as a cache key in Redis or your database. Check this key before executing business logic.
The EventBus retains events based on your configured retention policy. Tune maxAge and maxMsgs settings based on your recovery requirements. Longer retention enables replay during extended outages but consumes more storage.
Securing Webhooks
Exposing webhooks to the internet creates an attack surface. Implement defense in depth:
HMAC validation verifies that incoming webhooks originate from legitimate sources. Configure the webhook.hmac field in your EventSource with a shared secret. GitHub, GitLab, and most SaaS providers support HMAC signatures.
Network policies restrict which pods can communicate with your EventSource. Limit ingress to your load balancer or API gateway. Block direct cluster-internal access unless explicitly required.
Rate limiting at the ingress layer prevents denial-of-service attacks. Configure your ingress controller to throttle requests per source IP.
When Argo Events Falls Short
Argo Events excels at bridging external events to Kubernetes-native workflows. It struggles with sub-second latency requirements—the EventBus adds 50-200ms overhead. For real-time processing, consider direct integration with Apache Kafka or NATS.
Complex event processing (aggregating events over time windows, pattern matching across streams) requires dedicated CEP engines like Apache Flink. Argo Events handles simple filtering and transformation but lacks stateful stream processing capabilities.
With these production considerations addressed, you have the foundation for reliable event-driven automation in Kubernetes.
Key Takeaways
- Start with a simple webhook EventSource and basic Kubernetes Job trigger before adding complexity—validate your EventBus connectivity first
- Use branch and repository filters in your Sensors to avoid triggering workflows on every push across your organization
- Always configure HMAC secret validation on webhook EventSources to prevent unauthorized event injection
- Leverage Argo Workflows triggers when you need parameterized, multi-step pipelines with conditional logic and artifacts