
Amazon RDS in Production: Performance Tuning That Actually Moves the Needle
Your RDS instance is costing you more than it should, and it’s still the first thing to buckle when traffic spikes. You’ve scaled up the instance class, bumped allocated storage, and spent an afternoon reading through AWS parameter group documentation. Query latency keeps climbing anyway. On-call engineers are getting paged. The database team is getting blamed.
The instinct is to throw more compute at it. That instinct is usually wrong.
Most RDS performance degradation in production doesn’t come from a single bottleneck—it comes from three or four interacting problems that each look tolerable in isolation. A gp2 volume that’s quietly throttling at peak. An instance family optimized for memory when your workload is CPU-bound. A parameter group that still has default values set for a generic workload, not yours. A monitoring setup that shows you CPU and free storage but nothing about I/O wait or buffer pool efficiency. None of these kills you alone. Together, they explain why your p99 latency doubles every Friday afternoon.
The other part of the problem is the abstraction itself. With self-managed Postgres or MySQL, you control the OS, the filesystem, the scheduler. With RDS, that layer is gone. Engineers who migrate from self-managed databases spend real time discovering which knobs still exist, which have been replaced by AWS-specific equivalents, and which problems now require a completely different mental model to diagnose.
RDS performance problems cluster into four categories: instance sizing, storage I/O, parameter group tuning, and query inefficiency. Understanding which category you’re actually in—and what AWS owns versus what you own—is where the work starts.
Why RDS Performance Problems Are Different from Self-Managed Databases
Running PostgreSQL or MySQL on EC2 gives you the full control surface: kernel parameters, filesystem mount options, CPU affinity, NUMA topology, network interrupt coalescing. RDS removes all of that. The tradeoff is operational simplicity, but it creates a specific trap—engineers accustomed to self-managed databases reach for knobs that no longer exist, miss the ones that do, and conclude that RDS is a black box. It is not.
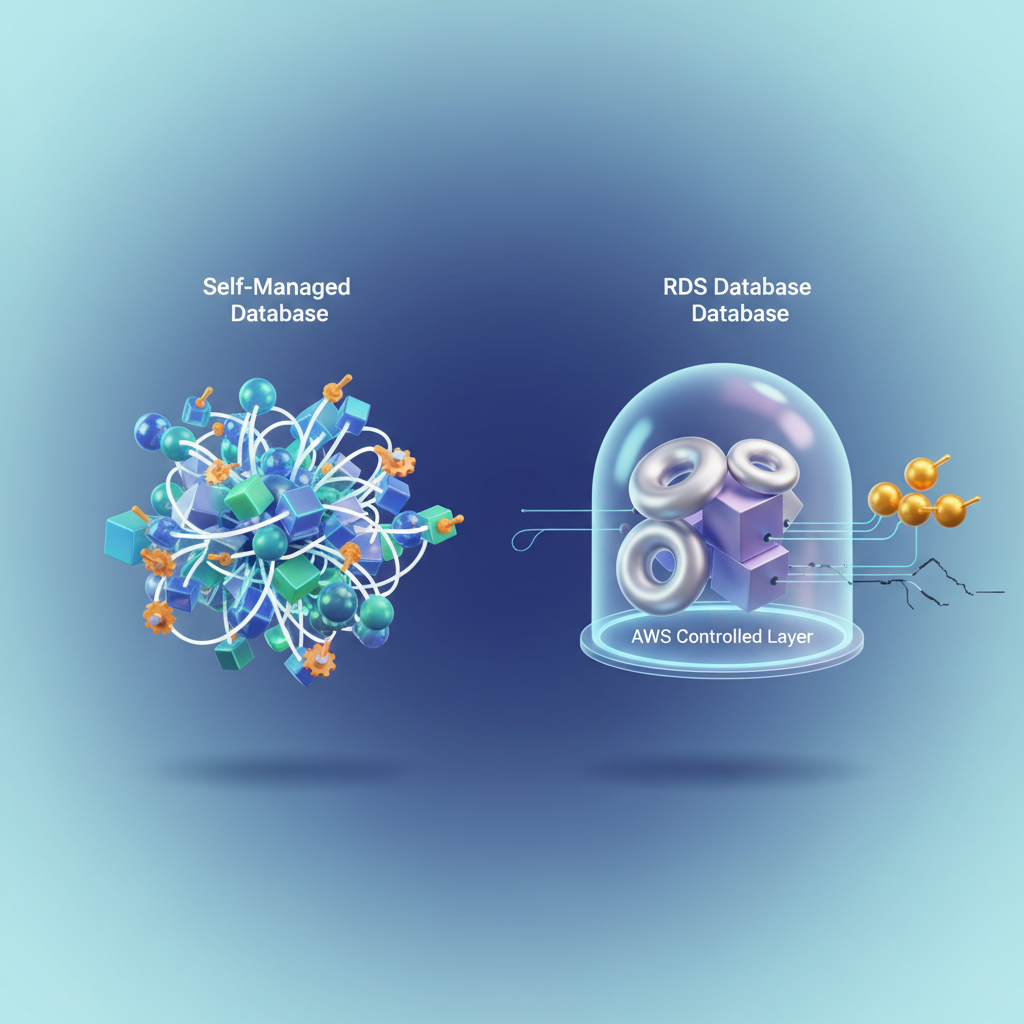
The abstraction is selective. AWS owns the OS, the storage hardware, the replication layer, and the binary patching cycle. You own the instance class, the storage configuration, the parameter group, the query patterns, and the connection model. Once you internalize that boundary, the performance surface becomes legible.
The Four Categories Where RDS Performance Problems Actually Live
Production RDS issues cluster into four areas, and almost every bottleneck traces back to one of them:
Instance sizing — The wrong instance family creates CPU or memory pressure that no amount of query tuning will fix. Memory-optimized instances (r-family) and general-purpose instances (m-family) behave differently under the same workload. vCPU count matters less than memory-to-working-set ratio and network bandwidth to storage.
Storage I/O — gp2 volumes have a burst credit model that looks fine under load tests and falls apart at steady-state production traffic. IOPS starvation at the storage layer surfaces as query latency variance, not CPU spikes, which makes it easy to misdiagnose.
Parameter group tuning — RDS exposes hundreds of engine parameters through parameter groups. The defaults are conservative and safe for general workloads. Production databases with known access patterns leave significant performance on the table by never touching them.
Query inefficiency — The layer you control entirely. Slow queries, missing indexes, lock contention, and N+1 patterns are engine-agnostic problems that RDS Performance Insights surfaces clearly once you know what to look for.
💡 Pro Tip: When investigating an RDS performance issue, identify which of these four categories it belongs to before touching anything. Storage I/O problems that get addressed with parameter group changes waste time and introduce risk without fixing the root cause.
The shared-responsibility model here is not a constraint—it is a diagnostic filter. AWS guarantees hardware performance within the instance class you select. Everything above the hypervisor is your responsibility and your lever.
The next section covers instance right-sizing in detail: how to evaluate your current instance family against your workload profile, and how to use CloudWatch and the AWS CLI to build a data-driven case for a change.
Instance Right-Sizing: Picking the Right Family, Not Just More vCPUs
Throwing more vCPUs at an RDS performance problem is the most common and most expensive mistake production teams make. Instance family selection is an architectural decision, not a slider—and choosing the wrong family degrades performance in ways that don’t show up until your peak traffic window.
Know Your Family Before You Size
The three families you’ll encounter in most production decisions each carry different trade-off profiles:
r-family (r6g, r7g, r6i) instances are memory-optimized. For RDS, memory is your primary resource: it governs the buffer pool size, which determines how much of your working dataset stays cached and off disk. Choose r-family when your working set is large relative to available RAM, your query plans involve significant sort and hash operations, or you’re running PostgreSQL or MySQL with a high connection count.
m-family (m6i, m7g) instances balance compute and memory at roughly half the RAM-per-vCPU ratio of r-family. They’re appropriate when CPU is genuinely the bottleneck—compute-heavy reporting workloads or aggressive JSON processing—but this is the exception, not the rule for OLTP.
t-family (t3, t4g) instances are burstable. In a dev environment or low-traffic internal tool, they’re cost-effective. In production, they will betray you. CPU credits drain silently during off-peak hours and the instance drops to baseline performance—often 20% of nominal—exactly when load spikes. Never run production OLTP on t-family.
Memory-to-Connection Ratio as Your Primary Sizing Signal
CPU utilization misleads. An instance sitting at 40% CPU can still be thrashing on memory if your connection count is high. Each database connection in PostgreSQL consumes roughly 5–10 MB of RAM before it processes a single query. At 500 connections on a db.r6g.large with 16 GB RAM, you’ve consumed 5 GB in connection overhead alone—before the buffer pool does any work.
Calculate your minimum viable RAM: (max_connections × 8 MB) + (desired buffer pool size). If the result exceeds 60% of your instance’s available RAM, size up.
Detecting Chronic Undersizing with CloudWatch
Pull the three metrics that expose real resource pressure against your instance:
#!/bin/bashDB_INSTANCE="my-production-db"REGION="us-east-1"END=$(date -u +"%Y-%m-%dT%H:%M:%SZ")START=$(date -u -d "24 hours ago" +"%Y-%m-%dT%H:%M:%SZ")
for METRIC in FreeableMemory CPUCreditBalance DatabaseConnections; do  echo "=== $METRIC (last 24h) ==="  aws cloudwatch get-metric-statistics \    --region "$REGION" \    --namespace AWS/RDS \    --metric-name "$METRIC" \    --dimensions Name=DBInstanceIdentifier,Value="$DB_INSTANCE" \    --start-time "$START" \    --end-time "$END" \    --period 3600 \    --statistics Average Minimum Maximum \    --output tabledone
Interpret the output with these thresholds: FreeableMemory averaging below 2 GB signals your buffer pool is competing with OS overhead. CPUCreditBalance trending toward zero means your t-family instance is operating on borrowed time. DatabaseConnections consistently above 80% of max_connections means you’re one traffic spike away from connection refusal.
Multi-AZ and Read Replica Placement
Multi-AZ standby instances consume the same resources as the primary and participate in synchronous replication—they don’t serve reads. If you’re counting your read replica’s capacity toward your total read throughput budget, confirm replicas are in the same region and on an equivalent instance class. A db.r6g.2xlarge primary replicating to a db.r6g.large replica creates an asymmetric setup where the replica becomes the bottleneck under read-heavy load.
💡 Pro Tip: Use the AWS Compute Optimizer recommendations for RDS—it analyzes 14 days of CloudWatch data and surfaces right-sizing candidates with projected cost and performance impact. Run it before any instance class change to validate your manual analysis.
With your instance family locked and sized to your actual workload signals, the next leverage point is storage. gp2 volumes have a credit-based burst model nearly identical to t-family CPU credits—and they cause the same kind of invisible performance cliffs at exactly the wrong moment.
Storage Configuration: gp2 Is Probably Costing You More Than You Think
If your RDS instance is running on gp2 storage and you’re seeing periodic latency spikes during sustained write periods, the storage type is almost certainly the cause. gp2’s burst credit model is the culprit, and it creates a failure mode that’s invisible until it hits production.
The gp2 Burst Bucket Problem
gp2 volumes earn IOPS credits at a rate of 3 IOPS per GB per second, up to a maximum burst of 3,000 IOPS. A 500 GB volume baseline is 1,500 IOPS—so bursting to 3,000 is sustainable only as long as the credit bucket doesn’t empty. Under a sustained write load that exceeds your baseline, the bucket drains. When it hits zero, performance falls off a cliff back to baseline. That cliff shows up in your p99 latency metrics as a periodic, reproducible spike every few hours.
The spike pattern often gets misdiagnosed as a query problem, a lock contention issue, or an application bottleneck. Engineers spend hours in slow query logs looking for something that isn’t there, when the real answer is on the storage configuration page.
Migrating to gp3: The Right Move for Most Workloads
gp3 decouples IOPS and throughput from volume size entirely. You provision 3,000 IOPS and 125 MB/s baseline at no extra cost versus gp2 pricing, and you can scale up to 16,000 IOPS and 1,000 MB/s independently. There is no burst bucket. Performance is flat and predictable.
The following script modifies a running RDS instance to gp3 and provisions explicit IOPS based on your measured workload requirements. RDS applies this change with a brief I/O interruption in a Multi-AZ deployment, so schedule it during a low-traffic window.
import boto3
rds = boto3.client("rds", region_name="us-east-1")
INSTANCE_ID = "my-production-db"TARGET_IOPS = 6000       # Provision based on your CloudWatch ReadIOPS/WriteIOPS peaksTARGET_THROUGHPUT = 250  # MB/s; max 1000 for gp3
response = rds.modify_db_instance(    DBInstanceIdentifier=INSTANCE_ID,    StorageType="gp3",    Iops=TARGET_IOPS,    StorageThroughput=TARGET_THROUGHPUT,    ApplyImmediately=False,  # Apply during next maintenance window)
current = response["DBInstance"]print(f"Instance: {current['DBInstanceIdentifier']}")print(f"Storage type pending: {current.get('PendingModifiedValues', {}).get('StorageType', 'none')}")print(f"IOPS pending: {current.get('PendingModifiedValues', {}).get('Iops', 'none')}")
To determine your TARGET_IOPS, pull the last 14 days of ReadIOPS and WriteIOPS from CloudWatch and use the 95th percentile value, not the average. Provisioning to average demand leaves you exposed to the exact latency spikes you’re trying to eliminate.
When io1/io2 Block Express Makes Sense
gp3 handles the majority of production RDS workloads. io2 Block Express becomes worth evaluating when you consistently need more than 64,000 IOPS, require sub-millisecond latency at high queue depth, or are running a workload with a very high write-to-read ratio on a large volume.
The break-even calculation is straightforward: gp3 charges separately for provisioned IOPS above 3,000 at approximately $0.005 per IOPS-month. io2 charges per IOPS-month at a higher base rate but includes higher durability guarantees (99.999% versus 99.8–99.9% for gp3). Run the numbers against your current provisioned IOPS. For most teams, the crossover point lands somewhere above 32,000 provisioned IOPS—below that, gp3 wins on cost every time.
Enabling Storage Autoscaling Without Runaway Costs
Storage autoscaling prevents the hard stop when a volume fills up, but without a ceiling it creates unbounded cost exposure. Always set MaxAllocatedStorage.
import boto3
rds = boto3.client("rds", region_name="us-east-1")
response = rds.modify_db_instance(    DBInstanceIdentifier="my-production-db",    MaxAllocatedStorage=2000,  # GB ceiling; autoscaling will not exceed this    ApplyImmediately=True,)
print(f"Max allocated storage: {response['DBInstance'].get('MaxAllocatedStorage')} GB")
Set your ceiling at 150–200% of your current allocated size. That gives autoscaling room to operate through growth spikes without letting a runaway bulk insert or a schema migration balloon your bill indefinitely. Pair this with a CloudWatch alarm on FreeStorageSpace that fires at 20% remaining—autoscaling handles the routine growth, but the alarm catches anything pathological.
💡 Pro Tip: After migrating from gp2 to gp3, verify the change took effect by checking
StorageTypeindescribe_db_instances. The AWS Console sometimes shows a cached state for several minutes. Trust the API response, not the UI.
With storage no longer the source of latency spikes, the next lever to pull is the parameter group—where default RDS settings frequently leave significant performance on the table for real production workloads.
Parameter Group Tuning for Real Workloads
Default RDS parameter groups are tuned for compatibility, not performance. They represent the lowest common denominator across instance sizes, workload types, and use cases. For any production workload running more than a few hundred queries per second, custom parameter groups deliver measurable throughput gains.
MySQL and Aurora MySQL: The Parameters That Move the Needle
Three parameters account for the majority of MySQL performance wins on RDS.
innodb_buffer_pool_size controls how much data InnoDB caches in memory. On a dedicated database instance, set this to 75% of available RAM. For an r6g.2xlarge with 64 GB, that means 48 GB. The RDS default leaves this far too low for most workloads.
max_connections needs to match your actual connection pattern, not RDS’s conservative default. A common mistake is setting this to an arbitrarily large number and letting connections pile up. Instead, size it to (available_memory_in_bytes / 12582880) as a starting formula, then adjust based on observed wait states.
Query cache settings — disable them entirely on MySQL 5.7 and earlier for write-heavy workloads. query_cache_type=0 and query_cache_size=0 eliminate the cache mutex contention that tanks throughput under concurrent writes. Aurora MySQL removes the query cache entirely, which is one reason it handles mixed workloads better.
PostgreSQL: Buffer Management and Checkpoint Behavior
PostgreSQL on RDS requires tuning four parameters to meaningfully improve OLTP performance.
shared_buffers should be set to 25% of total instance memory. Unlike InnoDB, PostgreSQL relies heavily on the OS page cache for the remainder, so aggressive shared buffer sizing beyond 25% often hurts rather than helps.
work_mem controls per-operation sort and hash memory. For OLTP, start at 4–16 MB. Multiply this by the maximum number of concurrent queries and sort operations per query to estimate total memory impact before raising it.
effective_cache_size is a planner hint, not an allocation. Set it to 75% of RAM so the query planner favors index scans over sequential scans. Getting this wrong causes the planner to choose suboptimal plans even when the data fits in memory.
checkpoint_completion_target=0.9 and wal_buffers=64MB reduce checkpoint I/O spikes that show up as latency outliers under sustained write load.
SQL Server: Parallelism and Memory Limits
For SQL Server on RDS, two parameters have outsized impact. Set max degree of parallelism (MAXDOP) to the number of physical cores per NUMA node, not the total vCPU count. Set cost threshold for parallelism to 50 rather than the default of 5 — this prevents the optimizer from reaching for parallel plans on queries that complete in milliseconds and introduces unnecessary coordination overhead.
💡 Pro Tip: RDS does not give you access to
sp_configuredirectly for all settings. Use parameter groups for supported parameters and RDS option groups for engine-specific features. Check the RDS documentation for your engine version to confirm which parameters are modifiable.
Applying Parameter Groups Without a Maintenance Window
Dynamic parameters apply immediately without a reboot. Static parameters require an instance restart. The boto3 script below creates a custom parameter group for PostgreSQL 16 and applies the critical parameters:
import boto3
rds = boto3.client("rds", region_name="us-east-1")
rds.create_db_parameter_group(    DBParameterGroupName="prod-postgres16-oltp",    DBParameterGroupFamily="postgres16",    Description="Tuned parameters for OLTP workloads",)
rds.modify_db_parameter_group(    DBParameterGroupName="prod-postgres16-oltp",    Parameters=[        {"ParameterName": "shared_buffers",          "ParameterValue": "16384",  "ApplyMethod": "pending-reboot"},        {"ParameterName": "work_mem",                "ParameterValue": "16384",  "ApplyMethod": "pending-reboot"},        {"ParameterName": "effective_cache_size",    "ParameterValue": "49152",  "ApplyMethod": "pending-reboot"},        {"ParameterName": "checkpoint_completion_target", "ParameterValue": "0.9", "ApplyMethod": "immediate"},        {"ParameterName": "wal_buffers",             "ParameterValue": "65536",  "ApplyMethod": "pending-reboot"},    ],)
rds.modify_db_instance(    DBInstanceIdentifier="prod-postgres-primary",    DBParameterGroupName="prod-postgres16-oltp",    ApplyImmediately=False,)
print("Parameter group applied. Reboot scheduled for next maintenance window.")
Set ApplyImmediately=False to defer the reboot to the maintenance window and avoid an unplanned availability event. Dynamic parameters like checkpoint_completion_target take effect immediately regardless of this flag.
Parameter tuning eliminates a broad class of performance problems, but it operates blind without visibility into what the database is actually doing at runtime. The next section covers Performance Insights and Enhanced Monitoring — the instrumentation layer that tells you whether your tuning changes are working and where the remaining bottlenecks live.
Performance Insights and Enhanced Monitoring: Reading the Signals
Basic CloudWatch metrics tell you something is wrong. Performance Insights and Enhanced Monitoring tell you why. The difference between a 10-minute postmortem and a 3-hour war room often comes down to whether you have the right signals instrumented before the incident starts.
Decoding Wait Events with Performance Insights
Performance Insights surfaces what your database engine is actually waiting on, broken down by SQL statement, user, host, and application. The three wait categories that cause most production incidents are:
- Lock contention (
wait/synch/mutex/*,lock/table/sql/handler) — long-running transactions blocking writes - I/O waits (
io/file/innodb/innodb_data_file) — storage throughput exhausted or IOPS depleted - CPU pressure (
CPU) — query plan regressions, missing indexes, or sudden traffic spikes
The RDS Performance Insights API lets you pull this data programmatically and route it into your own dashboards or alerting pipeline:
import boto3from datetime import datetime, timedelta, timezone
pi = boto3.client("pi", region_name="us-east-1")
RESOURCE_ID = "db-ABCDE12345FGHIJ67890KLMNO"  # DbiResourceId from describe_db_instances
response = pi.get_resource_metrics(    ServiceType="RDS",    Identifier=RESOURCE_ID,    StartTime=datetime.now(timezone.utc) - timedelta(hours=1),    EndTime=datetime.now(timezone.utc),    PeriodInSeconds=60,    MetricQueries=[        {            "Metric": "db.load.avg",            "GroupBy": {"Group": "db.wait_event", "Limit": 5},        }    ],)
for metric in response["MetricList"]:    print(f"Wait event: {metric['Key']['Dimensions'].get('db.wait_event.name', 'CPU')}")    for dp in metric["DataPoints"]:        print(f"  {dp['Timestamp']}: {dp['Value']:.4f} AAS")
Average Active Sessions (AAS) above your vCPU count is the threshold that matters. When AAS exceeds vCPUs and the dominant wait is I/O, you have a storage constraint — not a CPU one. Provisioning more compute solves nothing. Feed this data into a time-series store alongside your deployment and traffic event history, and you gain the ability to correlate load spikes with specific releases or schema migrations — turning reactive debugging into proactive capacity planning.
💡 Pro Tip: Enable Performance Insights with a 7-day retention window at minimum. The default 24-hour window disappears before your Monday morning incident review covers a Friday night event.
Enhanced Monitoring: The OS Metrics CloudWatch Skips
Enhanced Monitoring operates at the hypervisor level and reports metrics at 1-second granularity that standard CloudWatch never sees: per-process CPU breakdown, swap utilization, file system I/O per mount point, and network throughput split by interface. This granularity matters when you need to distinguish between a single runaway query consuming a core and a broader engine-level CPU regression that looks identical in aggregate CloudWatch graphs.
Enable it when creating or modifying an instance:
import boto3
rds = boto3.client("rds", region_name="us-east-1")
rds.modify_db_instance(    DBInstanceIdentifier="prod-mysql-primary",    MonitoringInterval=10,          # seconds: 1, 5, 10, 15, 30, or 60    MonitoringRoleArn="arn:aws:iam::123456789012:role/rds-enhanced-monitoring",    ApplyImmediately=True,)
Enhanced Monitoring data lands in CloudWatch Logs under the RDSOSMetrics log group in JSON format, not in the standard CloudWatch metrics namespace. Parse it with a Lambda subscription filter or ship it directly to your observability platform for long-term retention.
Swap usage above zero on an RDS instance is a hard signal that the instance class is undersized for the working set. CloudWatch FreeableMemory going to zero looks the same whether the OS is swapping aggressively or just managing page cache — Enhanced Monitoring tells you which. That distinction determines whether the correct response is a vertical scale-up or simply a buffer pool tuning adjustment.
Automated Alarms for Leading Indicators
Reactive alarms on ReadLatency and WriteLatency fire after the problem is already affecting users. Set alarms on the predictive metrics instead:
| Metric | Threshold | Signal |
|---|---|---|
DBLoad | Approaching vCPU count | Saturation imminent |
SwapUsage | Above 0 bytes | Instance undersized |
FreeStorageSpace | Below 20% | Disk exhaustion risk |
| Burst balance (gp2) | Draining trend | Sustained I/O above baseline |
Pair threshold alarms with anomaly detection on DBLoad and DatabaseConnections. A sudden drop in active sessions can indicate a connection storm that caused the engine to start refusing connections — a failure mode that latency alarms miss entirely because there are no queries completing to measure.
With the monitoring foundation in place, the next bottleneck to address is connection overhead — which silently taxes throughput even when your queries are fast and your storage is healthy.
Connection Pooling and RDS Proxy: Eliminating the Connection Overhead Tax
Every PostgreSQL and MySQL connection carries real overhead: memory allocation on the database server, authentication handshake cost, and process or thread spawning depending on the engine. For applications with persistent connections and predictable concurrency, this overhead is negligible. For Lambda functions and containerized microservices, it becomes a tax that compounds under load.

The Connection Storm Problem
Lambda’s execution model creates a structural mismatch with relational databases. Each invocation opens a connection, runs a query, and ideally closes cleanly—but at scale, hundreds of concurrent invocations hit the database simultaneously. A PostgreSQL instance on db.r6g.large supports roughly 500 max connections before memory pressure degrades query performance. A burst of Lambda traffic during a traffic spike saturates that limit in seconds, producing connection refused errors and cascading timeouts that look like application failures rather than infrastructure limits.
Container workloads on ECS or Kubernetes introduce a different variant: rolling deployments that briefly double the connection count as old tasks drain and new tasks initialize. Without pooling, this transient spike regularly trips max_connections at exactly the moment you need the deployment to succeed cleanly.
RDS Proxy: Multiplexing Without Application Changes
RDS Proxy sits between your application and the RDS instance, maintaining a warm pool of database connections and multiplexing client requests across them. From the application’s perspective, it connects to the Proxy endpoint exactly as it would connect to RDS directly—same driver, same connection string format, just a different hostname.
The Proxy’s connection multiplexing collapses hundreds of client connections into a fraction of that number against the actual database. A realistic outcome: 800 Lambda concurrency connections reducing to 30–40 active database connections, with the rest queued and served within milliseconds from the pool.
Pinning conditions to avoid: RDS Proxy cannot multiplex connections during transactions that use connection-level state—SET commands, temporary tables, and explicit LOCK TABLE statements force the Proxy to pin a client to a single backend connection for the duration of the session. Pinning defeats multiplexing. Audit your application code for these patterns before deploying Proxy and eliminate or isolate them.
IAM authentication integrates cleanly with RDS Proxy: the Proxy handles the database credential rotation transparently, retrieving secrets from Secrets Manager and rotating without dropping connections. Applications authenticate to the Proxy using IAM tokens, removing hardcoded credentials from connection strings entirely.
PgBouncer When Proxy Costs Don’t Justify Themselves
RDS Proxy is priced per vCPU of the underlying instance, adding meaningful cost for large instance families. For PostgreSQL workloads where that expense isn’t justified—internal tools, staging environments, or workloads with predictable concurrency—PgBouncer deployed as a sidecar container or dedicated EC2 instance delivers equivalent multiplexing at infrastructure cost only.
💡 Pro Tip: Use
SHOW POOLS;in PgBouncer’s admin console to observe active, idle, and waiting client counts in real time. If the waiting count consistently exceeds zero, increasepool_sizebefore your application starts surfacing timeout errors.
Measuring impact requires tracking two CloudWatch metrics before and after: DatabaseConnections (the raw connection count against RDS) and any custom application metric capturing connection acquisition latency. Expect DatabaseConnections to drop 60–80% under equivalent load. Connection wait time in your connection pool instrumentation should approach zero outside of genuine saturation events.
With connection overhead addressed, the final step is synthesizing everything covered—instance selection, storage, parameter tuning, observability, and pooling—into a repeatable pre-launch checklist that prevents production surprises.
Production Checklist: Putting It All Together Before Go-Live
Every RDS failure mode covered in the previous sections—connection exhaustion, storage saturation, replica lag—shares a common trait: they were preventable at launch. This checklist closes the loop.
Pre-Launch Hardening
Before traffic hits your instance, verify these are non-negotiable:
Durability and recovery
- Deletion protection enabled on every production instance
- Multi-AZ standby confirmed (verify with
aws rds describe-db-instances --query 'DBInstances[*].MultiAZ') - Automated backups set to a minimum 7-day retention window
- Final snapshot policy documented and tested
Security posture
- Encryption at rest enabled (AES-256 via AWS KMS); this cannot be toggled after creation
- Security groups locked to application subnets only—no 0.0.0.0/0 on port 3306 or 5432
- IAM database authentication enabled where connection counts allow it
Parameter group baseline
- Custom parameter group applied (never run on
default.*) - Key parameters reviewed against your engine version and instance class as covered in Section 4
Maintenance Window Strategy
Set your maintenance window to the lowest-traffic period your metrics actually confirm—not the one you assume. Pull your CloudWatch DatabaseConnections metric across four weeks to identify the true trough.
Test failover before go-live, not during an incident:
aws rds reboot-db-instance --db-instance-identifier my-prod-db --force-failoverMeasure the actual promotion time and confirm your application reconnects cleanly. Document it. RDS Multi-AZ typically promotes in 60–120 seconds, but your application’s reconnection logic determines the real recovery window.
Cost Optimization Cadence
Commit to Reserved Instances only after 30 days of production data. Use that window to validate your instance class choice using the Performance Insights load score from the monitoring section above. Schedule a quarterly right-sizing review—instance families evolve and your workload does too.
💡 Pro Tip: Enable AWS Compute Optimizer for RDS. It analyzes CPU, memory, and storage I/O patterns and surfaces downsize recommendations with projected savings, eliminating guesswork from your right-sizing cadence.
Top-Five Incident Runbook Summary
| Incident | First Action | Escalation Trigger |
|---|---|---|
| High CPU | Check Performance Insights top SQL | CPU > 90% for 10+ min |
| Storage full | Trigger storage autoscaling or manual modification | < 10% free space |
| Replica lag | Check write throughput and network saturation | Lag > 30 seconds |
| Connection exhaustion | Verify RDS Proxy health; check pool configuration | Errors in application logs |
| Parameter group misconfiguration | Compare pending-reboot parameters; schedule restart | Unexpected query plan changes |
The checklist above is your floor, not your ceiling. The real gains come from treating RDS as an observable system—and the monitoring primitives to do that are already in place.
Key Takeaways
- Migrate gp2 volumes to gp3 and provision explicit IOPS to eliminate burst-related latency spikes—most workloads see lower costs and better performance simultaneously
- Enable Performance Insights and set CloudWatch alarms on FreeableMemory, CPUCreditBalance, and DatabaseConnections before your next peak traffic event, not after
- Use RDS Proxy or PgBouncer for any workload where connection counts exceed 100 concurrent connections or where Lambda/containers are your primary clients
- Tune parameter groups starting with buffer pool/shared_buffers sized to 70-75% of instance RAM, then iterate using wait event data from Performance Insights